

Tag: Conservative led Gvt
Britain’s Economic Boom?
As the British economic crisis becomes more prolonged the outbreak of stupidity that greets every new piece of important economic data becomes more generalised. Previously there has been a campaign to suggest that austerity has led to recovery when the opposite is the case. The recovery is based unsustainably on rising consumption, led by government consumption. The publication of the latest GDP data for most major economies has now led to wild suggestions that Britain is booming and is the strongest major economy in the world.
The level of real GDP in Britain since the recession began at the beginning of 2008 is shown in the chart below. It is compared to the US and the Euro Area. British growth has been almost exactly the same as that of the Euro Area as a whole and significantly worse than US GDP growth.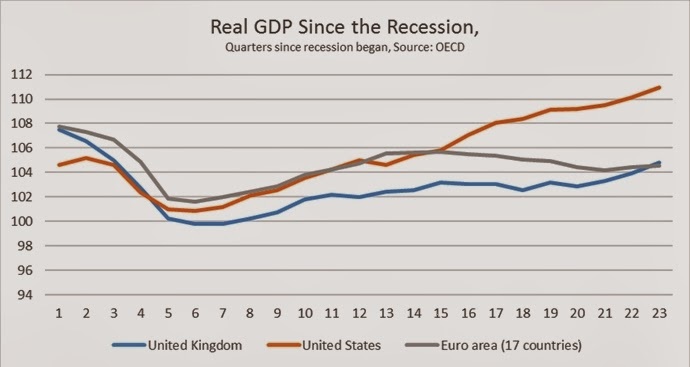

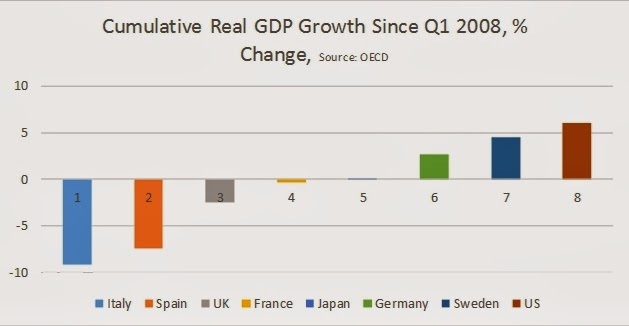
The cumulative change in real GDP for selected industrialised economies is shown in the chart below. Despite the potential advantage of independent policy setting the cumulative growth of the British economy is worse than the average, although not as poor as Italy and Spain. (The growth of the US economy is slightly overstated because official data now show that the US recession did not begin until the 3rd quarter of 2008)
Even compared to the last US recession, current performance has been variously described as ‘sluggish’ or ‘disappointing’. The US is frequently held out as a model of economic recovery. But it has recently entered its fifth year of economic expansion and GDP is just 10% above its low-point in 2009.
Authoritative economists such as Larry Summers (video) and Gavyn Davies and others have instead been discussing the ‘secular stagnation’ of the industrialised economies. Paul Krugman wonders whether this is ‘a permanent slump’.
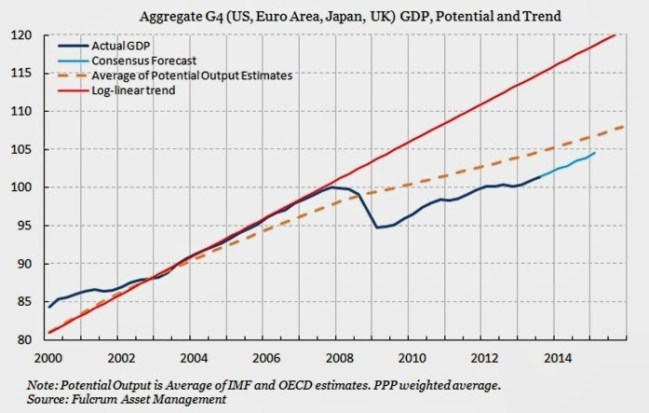
In the chart below Gavyn Davies shows the actual level of GDP in four economies combined (US, Euro Area, Japan and Britain) are shown along with the consensus forecasts for growth (the blue lines). The trend growth rate of those economies is shown the red line. The dotted yellow line shows the average estimate of potential output.
The red line represents previous level of growth whereas the dotted yellow line represents the average of estimate of what is now possible for growth. In both cases, actual and forecast GDP is set to remain below those levels for some time. But much slower growth projected by the depressed level of estimated potential output shows that the dominant idea is something close to ‘secular stagnation’ for the leading industrialised economies, something like 1.2% growth per year.
Summers and others correctly identify the main cause of the crisis as the slump in business investment, as SEB has argued. However he argues that this is because interest rates are above the level of anticipated return on investment. Yet the widely-acknowledged cash hoard of western firms belies this notion. The large firms which overwhelmingly account for investment have no need to borrow to invest as a result of this cash mountain. They are hoarding cash because the anticipated return itself has fallen. The anticipated return is otherwise known as the profit rate.
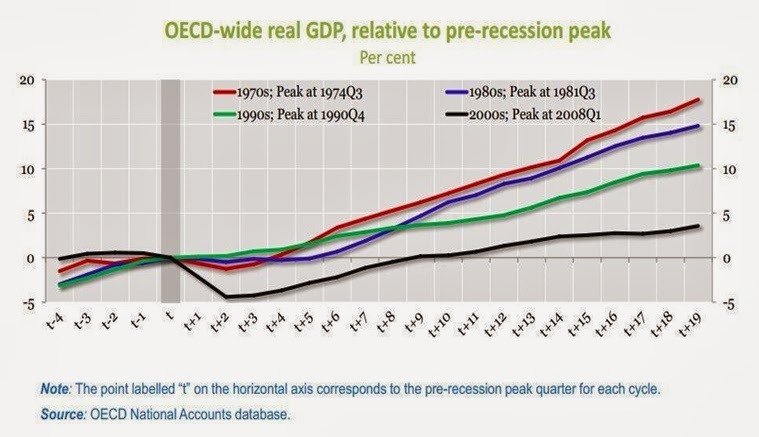
The stark long-term consequence of this trend towards declining profitability, lower rates of investment and cash hoarding are shown in a recent chart from the OECD, below. A turning-point in the world economy occurred at the beginning of the 1970s as the long post-War boom was brought to an end. Since that time each recovery from recession in the OECD has been weaker than the preceding one. The Reagan/Thatcher offensive to restore profits has led instead to a progressive weakening of the OECD economies.
The current slump had the weakest growth prior to the recession and the most severe downturn as well as the weakest recovery from it. A hat-trick of neoliberalism.
The growth of the British economy conforms to these patterns and sits in the middle-to-lower band among the OECD economies. The OECD predicts 1.4% GDP growth in Britain for 2013 and 2.4% in 2014.
Only a complete fraudster would describe the British economy as the strongest in the world. Only someone entirely ignorant of both recent and historical economic trends would describe either current or forecast growth in Britain as a boom.
Only a complete fraudster would describe the British economy as the strongest in the world. Only someone entirely ignorant of both recent and historical economic trends would describe either current or forecast growth in Britain as a boom.
Why Northerners don’t vote Tory
by Peter Kellner in Commentary, Editor’s picks, Front Page and Politics
Mon October 21, 2013 9:32 a.m. BST
YouGov President Peter Kellner on why the Conservative party’s trouble with northerners may have less than to do with economic, ideological or social factors than one might expect
Karl Marx was wrong; or, at any rate, unfair. He complained that philosophers “only interpreted the world” when the point was to change it. The trouble is, change is likely to work only when we understand what is wrong. The Conservatives badly want to change the voting habits in the north of England; but to do so, they must first answer the fundamental question: why don’t northerners vote Tory?
Want to receive Peter Kellner’s commentaries by email? Subscribe here
Some do, of course. George Osborne (Tatton, Cheshire) and William Hague (Richmond, North Yorkshire) have safe seats. But these are rare. Just 31% of northern voters backed the Tories in 2010, 12 points less than in the rest of England.
It used not to be like that. When Winston Churchill led the Conservatives back into power in 1951, the gap was just three points (North 47%, rest of England 50%). Over the decades, the North has drifted away from the rest of the country.
The past 60 years have seen massive economic and social changes. Perhaps these explain the remorseless decline of northern Tories? The problem with this explanation is that the most obvious change should have had the opposite effect. The old coalmining, ship-building, steel-working areas have gone. The old Lowry landscapes of billowing factories have all but disappeared. One might have expected Labour’s hold over the industrial North to have weakened, and for the Conservatives to have benefited from the transition to newer, less unionised and more fragmented northern economy. And, indeed, Labour’s support is down, from 52% in 1951 to 38% in 2010. But it has not gone to the Tories. The net swing between 1951 and 2010 was 1% to Labour in the North – but 5% to the Tories in the rest of England.
There is one specific explanation for a part of the Conservatives’ long-term decline in the North. In some cities working-class loyalties used to divide along religious lines. Catholics voted Labour while Protestants voted Conservative. This was why Tories won five out of nine Liverpool seats in 1951. But by the Seventies, this effect had largely gone – yet the relative decline of the northern Tory vote continued. Today, there are no Conservative MPs in Liverpool, Manchester, Sheffield, Leeds, Bradford or Newcastle upon Tyne.
One possible explanation is that votes correlate with income. Northerners are worse off and therefore less likely to vote Conservative. However, this explanation does not wash. For a start, standards of living for typical families are actually much the same in the North and South. Overall, spending power is substantially higher in London and the South East; but these figures are heavily influenced by the minority of very higher earners in and around the capital.
If we define the South as the South East and South West regions (that is, excluding London; it is the definition of “South” used in the data for this article), then median pay rates in the North are just 10% lower than in the South. Then, when we take account of living costs (in particular rents and house prices, which are far higher in the South), then that 10% difference almost completely disappears as far as most working families are concerned.
What, though, about non-working families? Isn’t unemployment far higher in the North? Could this explain Tory unpopularity? Again, the answer is little, if at all. True, unemployment in the North (9%) is higher than in the South (6%). But unemployment in the West Midlands is higher still, at 10% – yet the Tories still managed to win 40% of the vote there three years ago.
Even if living standards are comparable, two other factors are worth examining: social class and the division between public and private sector jobs. Northerners are more likely than southerners to have manual jobs and to work in the public sector.
To examine these, I have aggregated YouGov polls from September this year. They provide data on more than 40,000 people across Britain, including more than 9,000 northerners and almost 13,000 southerners. This enables us to look in some detail at the demographic groups within both parts of Britain.
Social class first. As with pay rates, the differences between North and South are not massive. Using the normal definition – the job held by the head of household, 46% of northerners are working class compared with 41% of southerners. This is not enough to explain more than a fraction of the difference in voting patterns. Indeed, if we look at the Conservative share of the vote within each social class, the regional differences remain vast:

As those figures show, unskilled workers in the South are as likely to vote Conservative as managers and professionals in the North. It’s a similar story with public and private sector employment, with public sector workers in the South supporting the Tories in much the same proportions as private sector workers in the north.

To explore these, I have looked at a variety of recent YouGov surveys and also put some new questions to YouGov’s panel. The results allow us to test four possible sets of reasons why northerners don’t vote Tory.However we carve the figures, objective factors – whether economic, social or employment – account for only a small part of the gulf in Tory fortunes between South and North. It follows that most of the differences, therefore, are subjective, and relate to the way northerners and southerners think.
First, financial. Even if living standards are comparable, do northerners feel differently about their current circumstances and future prospects? The chart shows that there is no material difference on three out of four measures – how comfortable people feel today, their (low) optimism about the next 12 month and their (much higher) optimism about the long-term future.
| 1. Financial | South % | North % |
| Are very/fairly comfortable financially | 37 | 35 |
| Expect household finances to improve in the next 12 months | 17 | 16 |
| Workers worried that job is secure | 38 | 44 |
| Optimistic about “what life hold for you over the next 10-20 years” | 59 | 60 |
In one respect attitudes do vary to a modest extent. Northerners in work are slightly more worried than southerners about losing their job. However, this seems to bear only a loose relationship with party loyalty. Once again, Midlands voters share similar economic numbers with the North (42% of Midlands workers feel insecure, versus 44% of northern workers) without sharing the same antipathy towards the Tories.
Second, ideology. From time to time YouGov asks people where they place themselves on a seven-point scale from “very left-wing” to “very right-wing”. Northerners and southerners show little difference, with only one in four describing themselves on “fairly” or “very” to one side or the other. At both ends of England, this minority divides evenly between left and right.
As for the role of government, the main, but again modest, difference is that northerners are more likely to have firm views one way or the other. More of them want the state to do and tax less – and more (though not many) want the state to do and tax more. Southerners are more content with the status quo.
| 2. Ideology | South % | North % |
|
Regard themselves as very / fairly left-wing Regard themselves as very / fairly right-wing |
12 12 |
14 12 |
|
In long term, government should do less and tax less In long term, government should do more and tax more |
21 4 |
25 10 |
|
Private sector should play bigger role in delivering public services Public sector should play smaller role in delivering public services |
23 37 |
19 31 |
| Think free market is best way to distribute goods and services | 29 | 24 |
| Would bring railways back into public ownership | 61 | 64 |
| Think Top tax rate should be 50% or more | 49 | 55 |
In other respects, northerners are more likely to hold traditional left-of-centre views: more of them would like the private sector to play a smaller role in delivering public services; fewer of them agree that the free market is the best way to distribute goods and services and more think the top rate of tax should be raised to at least 50%. On the one explicitly socialist policy we tested, nationalising the railways, almost two-thirds of people at both ends of Britain back the idea. Overall, the small ideological gap explains a bit of the north-south party divide; but that is all.
Third, social attitudes. Here, the only difference to excite a statistician concerns welfare. Big majorities in all parts of Britain share the Conservative view that welfare benefits generally should be reduced; but southerners (79% of whom think this) outpace northerners (71%). On other issues – immigration, gay marriage, prison sentences, the EU and Syria – the differences are negligible. Whatever is driving northerners away from the Conservatives, it is not social attitudes. Like southerners, they want Parliament to get tough with immigrants, criminals and welfare recipients; and like southerners, they broadly support gay marriage and are divided on Europe.
| 3. Social attitudes | South % | North % |
| Want to stop all migration | 48 | 50 |
| Think welfare benefits generally should be reduced | 79 | 71 |
| Support gay marriage | 53 | 56 |
|
More convicted criminals should be sent to prison Fewer convicted criminals should be sent to prison |
49 23 |
50 27 |
|
Would vote to stay in EU Would vote to leave EU |
39 43 |
40 41 |
|
Supported military action against Syria ahead of Commons vote Opposed military action against Syria ahead of Commons vote |
26 46 |
25 47 |
Ed Miliband is keen to present himself as a “One Nation” leader, stealing from the Tories the clothes designed by Benjamin Disraeli, who famously described England as “two nations between whom there is no intercourse and no sympathy”. Even if Disraeli’s two nations – the rich and the poor – persist in England today, they have little geographical expression. Whether judged by circumstance, experience or attitude, the striking thing about northerners and southerners is not how different they are, but how alike.
Which simply sharpens the question – if the obvious reasons for Conservative unpopularity in the North do not really hold up, what does explain why they are so disliked? The time has come to test the issue directly – attitudes towards the two main parties.
4. The parties. The data need to be viewed with care. It is only to be expected that Conservative supporters will give “pro-Tory” and “anti-Labour” answers to attitudinal questions about the two parties – and vice versa for Labour supporters. Moreover, it’s hard to tell whether a pro-Tory response is a cause for, or a consequence of, supporting the party.
What we can do is look at how the differences between North and South vary. Where views are pretty similar, it is reasonable to suppose that these do NOT explain the gulf in party loyalties; rather, we are looking for the big differences in view.
| 4a. Conservatives | South % | North % |
| Big Differences | ||
| Conservatives care more about the rich and affluent than ordinary people | 62 | 73 |
| Cameron out of touch | 32 | 42 |
| Cameron doing well as PM | 45 | 36 |
| Think coalition is bad ‘for people like you’ | 51 | 59 |
| Cameron has no clear principles | 39 | 47 |
| Modest differences | ||
| Think state schools would improve if Conservatives win next election | 28 | 21 |
| Think economy would grow stronger if Conservatives win next election | 40 | 34 |
| Small differences | ||
| Think Conservatives have taken tough but necessary decisions | 52 | 48 |
| Think coalition is good ‘for people like you’ | 24 | 22 |
| Conservatives have changed for better since their time in opposition | 35 | 34 |
| Think immigration would fall if Conservatives win next election | 28 | 28 |
| 4b. Labour | South % | North % |
| Big differences | ||
| Think economy would grow stronger if Labour wins next election | 19 | 30 |
| Miliband doing well as Labour leader | 26 | 35 |
| Small differences | ||
| Miliband out of his depth | 48 | 46 |
| Miliband too willing to give in to unions and left-wing | 49 | 47 |
| Labour has seriously lost touch with ordinary people | 59 | 59 |
This process helps us to rule out a number of explanations. It’s not that northerners are significantly less likely to think that the coalition is “good for people like you”, that the Conservatives “have changed for the better since their time in opposition” or that they “have taken tough but necessary decisions” to turn round Britain’s economy. Nor do they have less faith in the Tories’ ability to control immigration – few people in any part of England think this.
On the other side of the political ledger, northerners and southerners share similar views on whether Ed Miliband is too left-wing or out of his depth. A clear majority of southerners, 59%, think Labour “has seriously lost touch with ordinary people”; the proportion of northerners who think this is exactly the same.
There are modest differences when voters consider the practical consequences of Conservative rule. Southerners are slightly, but only slightly, more hopeful that a future Tory government would improve the economy or run state schools better.
Which brings us, finally, to the big differences. Northerners dislike David Cameron. They are significantly more likely to say he is out of touch and lacks clear principles, and much less likely to say he is doing well as Prime Minister. And despite the comparable living standards and levels of optimism, northerners are much more likely to think the coalition “is bad for people like you”. The widest gap of all, eleven points, concerns the proposition that the “Conservatives care more about the rich and affluent than ordinary people”. Big majorities in all parts of Britain think this, but the sentiment is especially intense in the North.
Not that the Tories have all the problems. Labour has parallel troubles in the South, where few voters think that Miliband is doing well or that the economy would grow stronger under Labour. The party has lost much of the respect, both for its leader and its competence, that it enjoyed under Tony Blair. Labour’s “southern discomfort” is alive and ill and living in towns and cities from Kent to Cornwall.
But the focus of this analysis concerns the North. The Tories’ problems did not start with Cameron, but neither have they lessened under his leadership. Rather, he reminds many northerners just why they dislike the Tory Party. It’s not because they are poorer, or more pessimistic, or further Left or more reliant on the state for their job: they aren’t – or, at any rate, not enough to explain their reluctance to vote Conservative. Nor is it because of what the coalition has actually done in the past three years – at most, this explains a fraction of the difference.
In the end, the Tories’ problem is not what they do; it’s what they are. Their trouble is their brand. They lost Scotland because they lost their reputation as a unionist party and came to be seen as an English party. They are losing the North because they are seen increasingly as a Southern party. This need not stop them winning a future election: there are enough constituencies in the Midlands and the South which, when added to the Tories’ isolated seats in the North, can give them a parliamentary majority. But few, even on the Conservative benches, would regard that as a wholly healthy prospect.
Leading Conservatives often admit they need more women and non-white faces on their benches. This analysis suggests that they also need many more people with regional accents. On its own, this won’t suddenly make the Tories popular on Merseyside or Tyneside; but as part of a long-term strategy to revive the Tory brand north of the Wash, it would be a start.
Soaring UK personal debt wreaking havoc with mental health, report warns
Centre for Social Justice says poorer people ‘bearing brunt of storm’ as debt hits £1.4tn – almost as high as economic output
-
Nicholas Watt, chief political correspondent
- The Guardian, Wednesday 20 November 2013

Credit card debt has trebled to £55.6bn since 1998 while overall personal debt including mortgages has reached £1.4tn. Photograph: Alan Schein Photography
Personal debt in Britain has reached £1.4tn – almost the same amount as Britain’s national economic output – according to a report that warns debt is wreaking havoc on people’s mental health and wellbeing.
Poorer people are “bearing the brunt of a storm” during which average household debt has risen to £54,000 – nearly double what it was a decade ago, the report by the Centre for Social Justice thinktank warns.
The report, entitled Maxed Out, found that almost half of households in the lowest income decile spent more than a quarter of their income on debt repayments in 2011. More than 5,000 people are being made homeless every year as a result of mortgage or rent debts.
Christian Guy, director of the thinktank established in opposition by the work and pensions secretary, Iain Duncan Smith, said: “Problem debt can have a corrosive impact on people and families. Our report shows how it can wreak havoc on mental health, relationships and wellbeing. Across the UK people are up until the early hours worrying about their finances and bills.”
The report, written by the former Labour work and pensions minister Chris Pond, found that:
• Personal debt in the UK, including mortgage lending, stands at £1.4tn – an average of £54,000 per household compared with £29,000 a decade ago.
• Consumer debt had trebled since 1993 and now stands at £158bn;
• More than 8m households have no savings, including half of low-income households;
• Outstanding debt on credit cards has almost trebled since 1998 to reach £55.6bn;
• There were 300,000 arrears on mortgage in 2012 – with 34,000 homes repossessed. This is a reduction of 30% from the peak of the recession but a 60% overall increase since 2006.
Pond said: “With falling real incomes and increasing costs of basic essentials, many – especially the most vulnerable – are sliding further into problem debt. The costs to those affected, in stress and mental disorders, relationship breakdown and hardship is immense. But so too is the cost to the nation, measured in lost employment and productivity and in an increased burden on public services.”
The report found that the decision of mainstream banks to refuse credit to the less well off has led to a dramatic increase in the demand for short-term credit – from payday lenders, pawnbrokers and doorstop lenders – which is now worth £4.8bn a year. More than 1.4 million people have no access to a bank account and “are effectively excluded from the entire financial sector”. This contributes to the “poverty premium”, a £1,280 annual surcharge on everyday goods and services faced by low-income households.
Payday lenders have increased their business from £900m in 2008-09 to more than £2bn – accounting for around 8m loans – in 2011-12. The number of people resorting to loan sharks has increased to 310,000 people.
The report says: “For the most financially excluded, there is often no option but to turn to illegal moneylenders. It is estimated that over 310,000 people borrow money from these criminals each year. Illegal moneylenders extort money from their victims, often arbitrarily raising interest rates, demanding payments or charging penalties. Their use of violence and intimidation terrorises people and communities, enforcing a ‘veil of silence’ that allows them to escape detection. This is an inexcusable crime in modern Britain.
Many of the side effects of problem debt can also work to drive people further into debt, creating a vicious cycle. While it is often hard to prove causation, there is a clear relationship between the following and problem debt: unemployment, family breakdown, addiction, and poor mental health. Similarly, many of these factors are interrelated, meaning problem debt can have diverse causes, requiring multidimensional support in order to fully resolve the underlying problems.”
