Despite growth in 2024, living standards fell. Inequality, weak public investment and government cuts threaten prosperity. Labour must offer voters something different.
The picture painted by official data for the UK economy in 2024 reveals a country broken by 14 years of Conservative party rule. True, the economy grew – somewhat unexpectedly – but GDP per head fell, showing prosperity didn’t reach most people. There are a few reasons for this decline but none suggests a healthy society. One is runaway wealth inequality, with gains hoarded at the top. Another is stark regional disparities, with some areas falling further behind despite national GDP rising. A third is rising immigration without enough job creation – more workers, but not enough well-paying positions.
A growing economy means little if it doesn’t improve living standards. In 2024, it didn’t. This political reality has shaped recent years, and not in a good way. It’s worth recalling a Newcastle woman’s tart response to the political scientist Anand Menon in 2016 when he warned that Brexit would hit GDP: “That’s your bloody GDP, not ours.” That continuing frustration explains the current backlash against mainstream politicians. No wonder Sir Keir Starmer wants his party to be one of disruption.
Thursday’s growth figures offer the prime minister a chance to break the mould of British politics. Unfortunately, he seems reluctant to act. What’s clear from the statistics is that, in 2024, government spending drove growth – boosted by rising wages, especially in the public sector – rather than business investment or net trade. Labour could challenge the status quo with a new economic vision centred on the state. Instead, unfortunately, the government promotes the idea that growth depends on government inaction in the face of unfettered capitalism.
Statistics often disguise the state’s role, framing public services as just another economic input rather than the engine of demand they are. This distortion makes the economy look more market-driven than reality, reinforcing neoliberal myths. The chancellor, Rachel Reeves, unfortunately, seems more eager to conform to these narratives than challenge them. She plans to cut public sector net borrowing from March 2025 to meet fiscal rules – austerity by another name. The last time this happened, post-2010, it led to a decade of weak growth and stagnant wages. The justice secretary, Shabana Mahmood, gets it. This week, she called out austerity’s role in wrecking probation services. If she was trying to change the chancellor’s mind, she deserves thanks. Britain can’t afford years of cuts.
One of John Maynard Keynes’ sharpest insights was what’s good for society isn’t always good for profits. That’s why the Green Alliance, a thinktank, is right – injecting £3bn into discounting rail fares to boost passenger miles by 22% is smart economics. It’s a win for regional growth, for the climate and for cleaner air. The state has the power to make capitalism work for the public – if it chooses to use it. But Labour’s delay on releasing its industrial strategy is a worrying sign.
The UK must move away from a debt-driven, low-wage, financialised economic model. Public investment in infrastructure – especially in underserved regions – and in skills and industry is needed to stimulate demand and create high-quality jobs. Raising wages and reducing inequality will ensure broad-based prosperity, not just asset bubbles. The belief that “markets know best” has prevented bold action on Britain’s yawning economic divides and the climate emergency. After 40 years of weakening the state and rewarding rentier capitalism, reform is urgent. Labour must build a system that delivers it.
Ronald Reagan and Margaret Thatcher walk Reagan’s dog Lucky on the White House lawn. Photo by Jim Hubbard/Bettmann Archive/Getty Images
Illustration by Ellie Foreman Peck
The American philosopher Michael Sandel and the French economist Thomas Piketty are among the world’s most influential political thinkers. In their writing on inequality and the moral limits of markets, both are critics of the neoliberal order that has governed the West for the past few decades, and of the capitalist system that has facilitated the savage iniquities of the global economy. In May 2024, they met at the Paris School of Economics. The US election was six months away, but the spectre of Trump was present throughout the conversation between the two thinkers.
“Trump’s victory seemed likely to me then,” Sandel recalled to the New Statesman, the day before the inauguration, “mainly because the Democratic Party had failed to address the legitimate grievances of working people and voters without university degrees.” When Kamala Harris inherited the nomination from Joe Biden, Sandel urged her, in a piece in the New York Times, “to break explicitly from the neoliberal version of globalisation that had brought growing inequality and decades of stagnant real wages for most workers”. The only way of defeating Trump, he felt, “was to speak convincingly to the widespread sense of disempowerment and to offer a bold project of democratic renewal”.
What the left needs, according to Sandel, is a “political vision that combines populism and patriotism – a radical critique of inequality and unaccountable, concentrated economic power (that’s the populism) and a greater emphasis on community, solidarity, and our mutual obligations as citizens (that’s the patriotism)”. It is a mistake, he argued, for the left to “cede patriotism to parties of the right”.
In their conversation, Piketty is optimistic about the march towards equality. Does Sandel retain the same degree of hope? “The richest men in the world, tech moguls Elon Musk, Jeff Bezos, and Mark Zuckerberg, are occupying seats of honour at Trump’s inauguration. Musk alone donated a quarter of a billion dollars to his presidential campaign. So it’s hard to be optimistic, at least in the near term.”
Trump’s “plutocratic populism”, though, Sandel pointed out, “may finally disappoint the working people who supported him. The question is whether progressives will have a more inspiring alternative to offer.”
The exchange between Sandel and Piketty, reproduced here, covers the challenge to progressives, globalisation, populism, and why we should care about inequality.
Michael Sandel: One way of exploring what equality means is by asking why inequality matters. Your research has revealed vividly to all of us just how stark the inequalities of income and wealth are. You’ve shown that in Europe the richest 10 per cent take in more than a third of the income and own more than half of the property. And in the United States, inequalities are even starker. Many of us find this troubling, but why exactly is it a problem?
Thomas Piketty: Let me first stress that I am optimistic about equality and inequality. In my book, A Brief History of Equality, I stress that, even though there’s a lot of inequality today in Europe, in the US, in India, in Brazil – all over the world – in the long run there’s been a movement toward more equality. Where does this movement come from? It comes from social mobilisation and a strong, enormous political demand for equality of rights in access to what people perceive to be fundamental goods, including education, health, the right to vote, and more generally to participate as fully as possible in various forms of social, cultural, economic, civic and political life. In your work you’ve stressed the role of self-government and participation. And I think this appetite for democratic participation and self-government is also what has been driving this movement toward more equality in the long run.
Now, it’s not been there forever, certainly not since prehistoric times. It starts in particular at the end of the 18th century with the French Revolution, the abolition of the privileges of the aristocracy, and with the American Revolution to some extent. And it continues in the 19th century with the abolition of slavery, the rise of labour movements, universal male suffrage, and then the rise of universal female suffrage. It continues in the 20th century with the development of social security, progressive taxation, and decolonisation, and it has continued even in recent decades. Sometimes we talk about the neoliberal era starting in the 1980s, as an era of rising inequality. And it is true to some extent. But in some dimensions of inequality, including gender inequality, racial inequality, and North-South inequality to some extent, the long-run movement toward more equality has continued. And it’s going to continue in the future, in my view. Why? Because together with the rise of modernity, you have the rise of democratic awareness, an appetite for equal access to fundamental goods, to participation in all forms, to dignity in all forms. And this is really the driving force, including for the monetary dimensions of inequality.
The numbers you mentioned about today’s high inequality levels are correct, but they were worse 100 years ago. They were even worse 200 years ago. So there’s been progress in the long run. It’s never been easy. It has always involved enormous political battles and social mobilisation. And it will continue like this. The good news is these are battles that can be won, and they have been won in the past. Studying these battles may be one of the best ways we have to prepare ourselves for the next steps.
MS: You’ve just identified three reasons why inequality is a problem. One is about access to basic goods for everyone. The second is about political equality – voice, power, participation – and then you mentioned briefly a third: dignity. I’d like to see if we can isolate these three reasons why equality and inequality matter. Let’s suppose, hypothetically, that we had the same inequalities of income and wealth we have today, but that we could somehow insulate the political process from those economic inequalities. So, let’s imagine that we could have public financing of campaigns with no private campaign contributions. Suppose we could regulate lobbying so that powerful companies and rich individuals could not have a disproportionate say in politics. Suppose we could somehow insulate political voice and participation from the effects of inequalities of income and wealth. And suppose we could address access to basic human goods – health, education, housing, food, transportation – through a more generous welfare state. So, we’re imagining we could address the first concern, access to basic goods, and the second concern, access to participation and political voice, but still leave intact inequalities of income and wealth. Would there still be a problem?
TP: I think there would still be a problem, in particular for basic dignity and in the human relations and power relations that come with inequality. Monetary distance is more than just monetary distance. It comes with social distance. Of course, companies’ influence on politics and media is one of the most visible impacts of money on the public sphere. And it’s hard to imagine how we could solve this problem with the kind of income and wealth scale that you have today. But even if we could, taking your thought experiment seriously, you would still have enormous inequality in purchasing power over the time of others. So, if by spending the equivalent of one hour of my income, I can buy your entire year of work, that implies kinds of social distance in human relations that raise very serious concerns and questions. So, the very formation of our ideals about democracy and self-government, which involves not only the formal organisation of political campaigns and formal access to news, but also all these more informal relationships in our local community – social relations where people interact with each other, enter into deliberation with each other – is threatened by enormous monetary inequalities.
Finally, in my view, the most important political and philosophical argument is really a historical argument, which is that historically we’ve been able to address all of these concerns together. We’ve been able to reduce inequality enormously – not just access to basic goods and participation, but also monetary inequality in income and wealth. If you look at today, even with the rise of inequality in recent decades, the income gap in Europe is much smaller than 100 years ago. This is less true in the US, but even in the US it is true compared to 100 years ago.
So, we’ve moved toward more equality in the long run, and not only has this not been at the expense of prosperity, but in fact this has been a key component of the rise of modern prosperity. Why? Because behind the enormous increase in prosperity that we’ve seen historically, the rise in a more inclusive and egalitarian socio-economic system – in particular with more inclusive access to education – has been absolutely critical.
Now, there are two limits to that. One is that when we talk about access to basic goods, we have to keep in mind that the goods that we viewed as basic 100 years ago are not the same as today. So today a big issue is how you have a fair system of education, including at the level of higher education. I think the fact that we’ve sort of given up on an ambitious egalitarian objective for higher education is at the source of many of our problems today – economic, and even more so democratic.
A second important caveat is the international and North-South dimension. A big part of the prosperity that we have in the North today, in Europe and in the US historically, has not only come through the rise of education and more inclusive investment in health and skills, which in a way is very positive – a win-win institutional transformation – but also the world division of labour. That’s in effect the exploitation of resources – natural resources and human resources – sometimes in a very brutal manner, and with the extra cost of threatening planetary sustainability, which we see more and more today. This to me is the main limitation of this positive movement toward more equality and more prosperity. But it is also one of the reasons why, in the end, I want to be optimistic, as I think the only way to address these new planetary challenges is to go even further in the direction of equality than we imagined in the past.
*****
MS: I want to pursue the question of globalisation as it has played out since the 1980s. Now, you and I have both been critical of hyper-globalisation and its insistence on the free flow of capital across borders, and on the free-trade agreements that were part of the neoliberal globalisation project. People like us criticise the unfettered, unregulated flow of capital and goods across borders, but we tend to be in favour of more generous immigration policies, which is the flow of people across borders. And those to the right of centre tend to be critical of increased levels of immigration, even as they endorse and promote the free flow of capital and goods. Which side is being inconsistent?
TP: Your question makes me think of my recent reading of the new edition of your book, Democracy’s Discontent, which was first published in 1996. There, you make very clear how the excesses of globalisation and the fact that left-of-centre governments in effect supported free trade, globalisation, financialisation, and also the rise of meritocratic ideology contributed to the weakening of democracy and the fact that the Republican Party broadly, and Donald Trump in particular, were able gradually to portray the Democrats as a party favouring the winners of the market.
Historically, the Democratic Party, like social democratic and labour parties in Europe, was a party supporting the working class, the lower-middle class, and with very little support from the top of the income and wealth distribution. Now, this has been reversed, and I think, instead of blaming Trump and blaming the Republicans – which is easy to do, of course – I think the Democrats in the US and comparable parties in Europe would be well advised to look at their own shortcomings.
And something I really enjoyed in the new edition of Democracy’s Discontent is the way you show that both the Clinton years, 1992-2000, and the Obama years, 2008-16 – two very long, eight-year administrations with Democratic presidents – were also administrations that legitimated the neoliberal turning point of Reagan in the 1980s. I mean legitimated in the sense that the Democratic administrations continued – maybe this is something you emphasise less than I do – the demolition of progressive taxation started by Reagan in the Eighties. Clinton and Obama did not really try to go against that. And, more to the point, both administrations went very far into the direction of globalisation and free trade, with Nafta [the North American Free Trade Agreement, signed in 1992], the creation of the WTO [World Trade Organisation, founded in 1995] and China’s entry to the WTO just after the end of the Clinton presidency.
Now, should we exercise more control over trade, capital, labour? I think you have to control something, and I think if you don’t control free trade, you don’t control capital flows, then indeed you’ll see the nativist and nationalist alternatives promoted by Trump or Brexiteers in the UK. They say, “OK, let’s control the labour flows.” In the end, I think my answer is that we should control the capital flows and the trade flows much more. With the labour flow, of course, you need to have rules about how you pay for education for the people who come, how you pay for housing. All of this needs to be looked at very carefully. We are not just transporting commodities when people come with their family. You need to look at the social conditions of integration and you have to make sure that all the right conditions are met. But in the end, this is a challenge that can be addressed if we control capital flows and trade flows.
I think that’s why we should be very careful to distinguish the different responses to the excesses of globalisation. You have the sort of nationalist response – nativist, anti-migrant – which we see with Trump, which we see with Marine Le Pen in my own country, etc. But then you also have what in the US was the Sanders response, which I like to call the democratic socialist response. And maybe one point of disagreement we might have is how you use the term “populist” to describe these two different responses to the excesses of globalisation. Of course, you make clear that this is not the same kind of populism, but still you use the term “populist”, which, as far as I’m concerned, I would not use. The term can be, to me, part of rhetoric that’s used a lot by people who claim to be in the centre, but who tend to be mostly the winners of the market process and who like to delegitimate all their opponents by saying: “All my opponents from the left, from the right, are all populists.”
MS: So, you would reserve it for right-wing populists?
TP: I would not use it at all, actually. I would talk about “nationalist ideology”, “socialist ideology”, “liberal ideology”. I think socialism, nationalism, liberalism are legitimate ideologies. They all have a point to bring to the democratic table, to the conversation. Calling them “populist” seems to me generally a strategy to delegitimate some of these groups. At least it can be used this way. I know this is not the way you want to use it, but so many people use it this way. And, as you were mentioning, restricting labour flows is very different from restricting capital flows. And so, if all opponents to free-market globalisation are populists, then we’re mixing up very different things.
MS: Let me try to address that. First, the use of “populism” – and this may reflect differences in nuance or usage between Europe and the US, but the reason I use it to describe Trump and Le Pen on one hand, and a figure like Bernie Sanders on the other, is that, at least in the American political tradition, the origin of the term “populist” in the 19th century was the coming together of industrial workers and farmers to try to win power from economic elites, typically north-eastern economic elites who controlled railroads and later the oil companies. It was a progressive movement, though, even then, it had nativist and anti-Semitic and racist elements. So these two strands – representing the people against the powerful, and this nativist strand – they’ve been present from the start. But in recent times, it seems to me that the success of right-wing populism, the authoritarian nativist strand, arises as a symptom of the failure of progressive or social democratic politics.
We saw this in the financial crisis of 2008, when first a Republican and then a Democratic administration, in the transition from George W Bush to Obama, bailed out Wall Street. In that moment of crisis, Obama had the choice of whether to restructure the relation of finance to the economy or to reinstate it, and he chose the second. I think this was a decisive moment for his presidency because it represented a departure from the civic idealism that he had inspired as a candidate in 2008, not only in the United States, but around the world – the hope and the expectation that this would be the beginning of a new kind of politics. And then when he took office just after the financial crisis, he appointed the same economists who had served in the Clinton administration, who had deregulated the financial industry. He invited them to try to fix things, and what they did was to bail out the banks and leave ordinary homeowners to fend for themselves.
Now, Obama acknowledged that the bailout was unjust. He said it pained him to bail out Wall Street, but he felt it was the only way, given the hold that Wall Street and big finance had on the economy. He wanted to save the economy. But the taxpayer bailout of Wall Street cast a shadow over his presidency. It dashed the hopes for a revival of progressive or social democratic politics that his candidacy had inspired. And it generated two currents of protest: on the left, the Occupy movement, followed by the surprisingly successful candidacy of Bernie Sanders in 2016 against Hillary Clinton; on the right, the Tea Party movement, and the election of Donald Trump.
Both of these strands grew from the anger and outrage and sense of injustice at the bailout and the building back up of Wall Street, without holding anyone to account. So in a way, the progressive, mainstream centre-left politicians who governed in the aftermath of Reagan and Thatcher laid the groundwork for the right-wing version of populism – of Trump in the case of the United States – that followed. They prepared the way for it and bear responsibility for it. When Reagan and Thatcher governed, they explicitly argued that government is the problem and free markets are the solution. They were succeeded by centre-left politicians and political parties – Bill Clinton in the United States, Tony Blair in Britain, Gerhard Schröder in Germany – who softened the harsh edges of thelaissez-faire capitalism of the Reagan-Thatcher years.
But they didn’t challenge the fundamental premise, the market triumphalist premise – namely, that market mechanisms are the primary instruments for defining and achieving the public good. They never challenged that. And so, when they adopted neoliberal trade policies and the deregulation of finance during the 1990s and early 2000s, they were enacting that project and uncritically embracing the market faith. And so we never really had a public debate about where markets serve the public good and where they don’t belong.
But there’s a deeper reason, I think, for the appeal of markets and market mechanisms. I think the deep appeal of the market faith during this period, and perhaps for a longer stretch of time, is that markets seem to offer a way of sparing us as democratic citizens from engaging in messy, contentious, controversial debates about how to value goods and how to value the various contributions that people make to the economy and to the common good. So the market faith arises from a certain liberal aspiration for neutrality toward substantive conceptions of values and the good life. The idea is this: we live in pluralist societies. We disagree about how to value goods. We disagree about the nature of the good life. So, ideally, we would like to rely on instruments that are neutral, that spare us from the need to make those decisions explicitly, because we will disagree. Now, of course, markets are not truly value-neutral instruments. We know that. But the misplaced hope that markets can spare us from debating and deciding contested questions about the common good is a deep source of their appeal.
TP: I agree with that. I think in the end, this is a fear of democracy. This is a fear of democratic deliberation. And this is a fear of what I refer to in my book, Capital and Ideology, as opening the Pandora’s Box of redistribution, but also of the revaluation of what we do. The fear is we don’t know where to stop, and maybe we don’t know where to stop. But in the end, our best chance to get somewhere is to accept this aspiration to self-government, which as you remind us in your writing is at the origin not only of some of the deepest aspirations of the US in the 19th century, but of modernity in general.
Let me come back just a little bit to this term “populist”. You very rightly said that Clinton, Obama, Blair, Schröder, were not able to question the new neoliberal Wall Street kind of ideology about globalisation, financialisation, meritocracy. They were not able to challenge this set of beliefs, but Bernie Sanders, and to some extent Elizabeth Warren, also in 2020, were able to challenge this by putting forward a platform that I like to call democratic socialism, because it goes even further than Franklin D Roosevelt did in terms of progressive taxation. But it also involves a very substantial component of workers’ decision-making power in corporations, with a strong representation of workers on the boards of companies. It also involves a very substantial decommodification strategy through public universities and a public health system. To me, this is not the expression of a sort of populist anger.
So, I’m still a bit puzzled why you want to label this “populist”. I understand the history of the term in the US. As you said, with the early populists in the late 19th century and the early 20th century, there was an uneasy mixture of progressive themes and nativist themes. I really don’t see that in Bernie Sanders and Elizabeth Warren. Calling them “populist”, I think, is giving too much weight to the way the Clintonians and the Blairites want to distance themselves from people further left. In the end, the position looks very much more like democratic socialism to me, or social democracy for the 21st century, if you want.
MS: Here, maybe, is a nuance of difference in what it means. Populism is not mainly about redistribution, though it does for Bernie Sanders and Elizabeth Warren have egalitarian meaning. It’s mainly about reclaiming power for the people from elites. And this is connected to economic inequality. But the populist strand, if it can be distinguished from the social democratic or democratic socialist strand, is less about redistribution than it is about reclaiming power, giving voice to the people, representing the people against the powerful.
Too often, liberals and social democrats have ignored people’s sense of disempowerment and dislocation, the frustration that they lack a meaningful say in shaping the forces that govern their lives. Progressive taxation is an important corrective to inequalities of income and wealth, and to underfunded public services. But it is not enough to renew progressive politics. Centre-left parties need to articulate a bold project of democratic renewal – a politics that honours the dignity of work, that accords social esteem and recognition to everyone who contributes to the common good, whatever their educational credentials, a politics that speaks to the anxieties of the age.
The full conversation between Thomas Piketty and Michael Sandel is published in “Equality: What It Means and Why It Matters” (Polity)
Purchasing a book may earn the NS a commission from Bookshop.org, who support independent bookshops
Stewart Lansleywrites that Britain’s model of ‘extractive capitalism’ – with a small elite securing an excessive slice of the economic cake – has created a two-century-long high-inequality, high-poverty cycle, one broken for only a brief period after the Second World War.
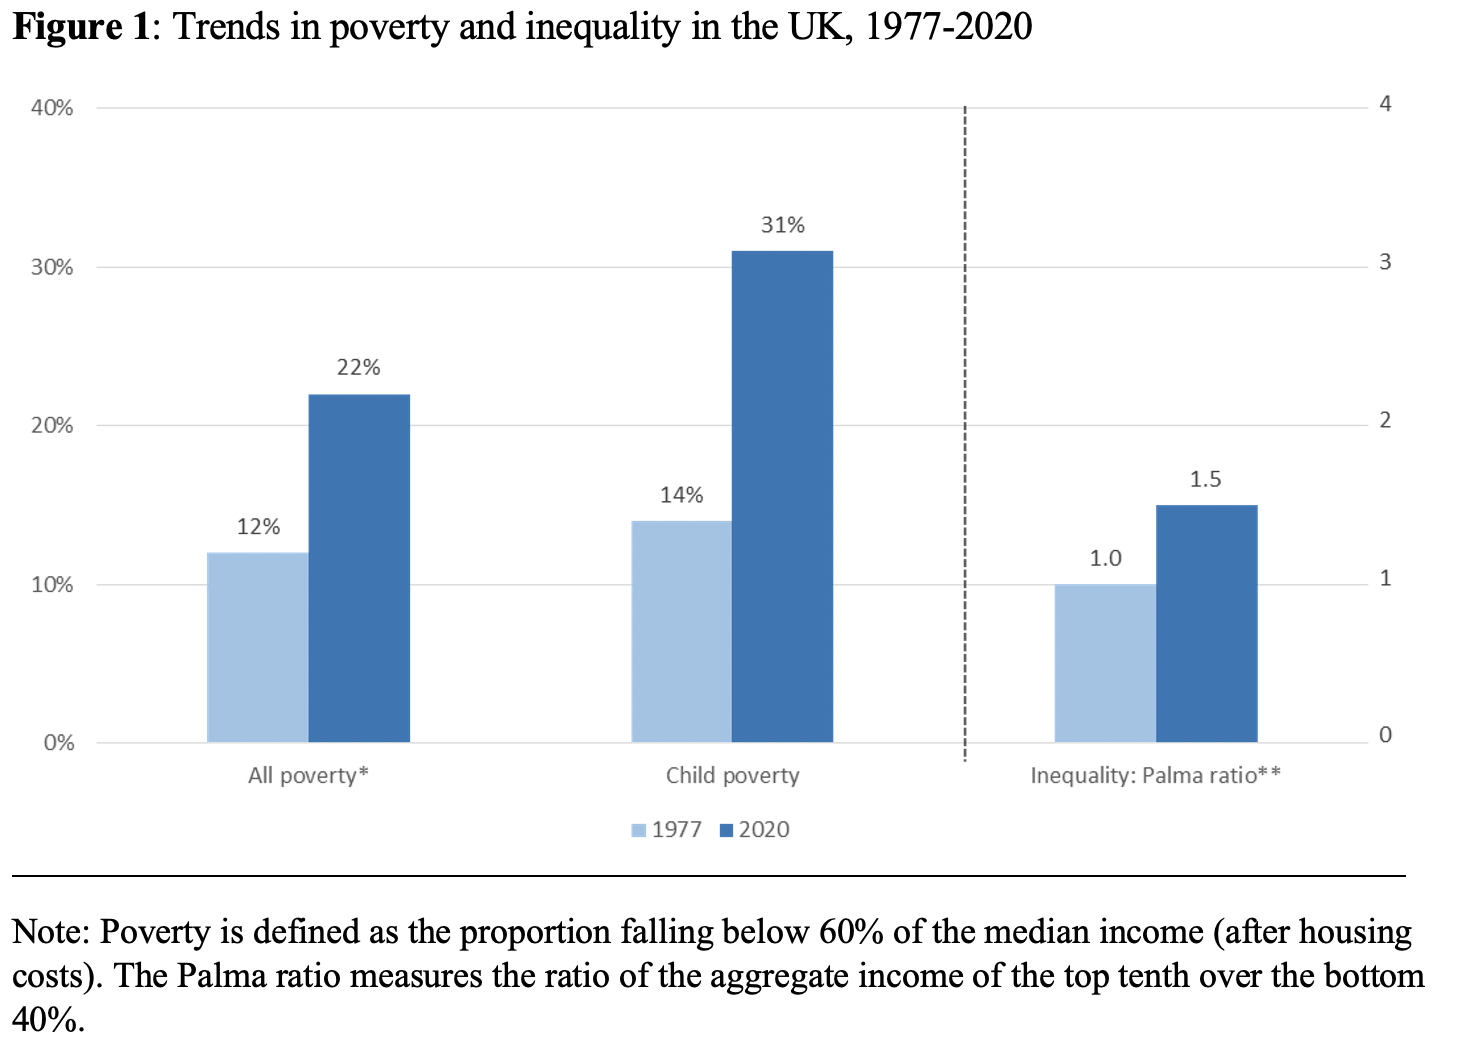
Over the last four decades, Britain has moved from being one of the most equal of rich nations to the second most unequal (after the United States). The same period has also seen a surge in levels of poverty, with the child poverty rate more than double that of the late 1970s (figure 1).
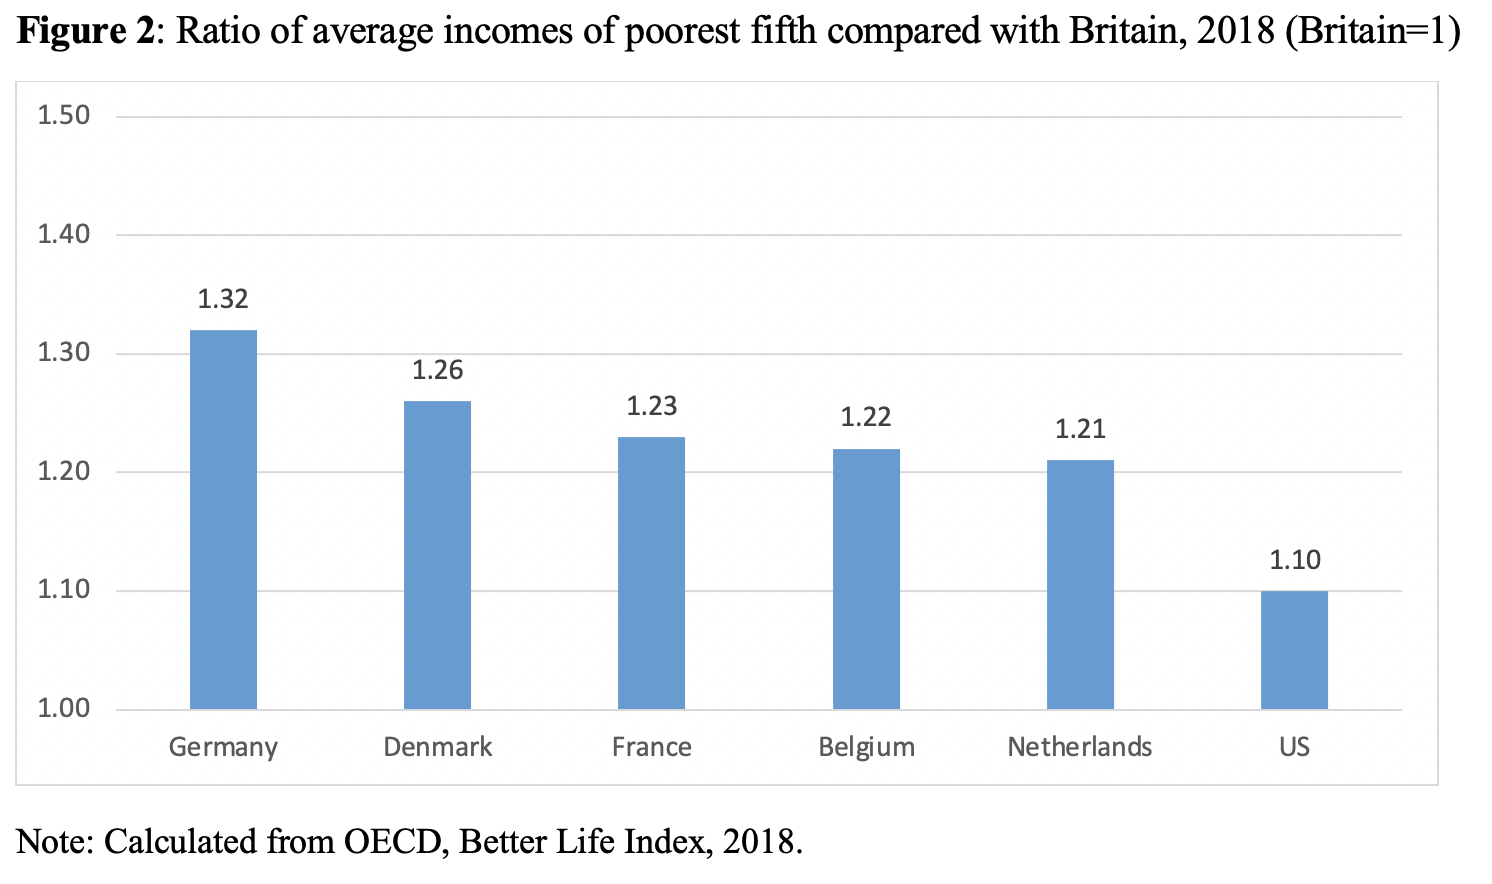
That these two key measures of social fragility have moved in line is no surprise. History cannot be clearer: poverty and inequality are critically linked. Poverty occurs when sections of society have insufficient resources to be able to afford a minimal acceptable contemporary living standard. Its scale is ultimately determined by how the ‘cake is cut’. Barring the short post-war period, Britain has been a high-inequality, high-poverty nation for most of the last 200 years, with significant consequences for life chances, social resilience, and economic strength. Because of the impact of inequality, the poorest fifth of Britons are today much poorer that their counterparts in other, more equal nations (chart 2). Germany’s poorest, for example, are a third better off than those in Britain.
Poverty and inequality levels are ultimately rooted in the outcome of the political and economic power games that play out between big business, state, and society. With the exception of the immediate post-war era, the struggles for share over the last 200 years have been won by the richest and most affluent sections of society, often with the compliance of the state.
For most of the nineteenth century, Britain was a near-plutocracy, with society run mostly by and for the richest sections of society. Colossal and heavily concentrated wealth sat beside crushing poverty through a form of collective monopoly power exercised by a small landowning, industrial and financial elite. The governing and wealthy classes created a form of ‘extractive capitalism’ aimed at securing a disproportionate share of the economic gains from industrialism, often by steering economic resources into unproductive use, with no or limited addition to economic value. ‘The efforts of men are utilized in two different ways’ declared the influential Italian economist Vilfredo Pareto in 1896. ‘They are directed to the production or transformation of economic goods, or else to the appropriation of goods produced by others’.
The long high poverty/inequality cycle and the strength of extraction are inter-connected. The cycle has only been broken once, when from 1945 the bitter ideological battle of ideas was finally won by pro-equality thinkers. The achievement of peak economic equality and an historic low for poverty in the 1970s was a seminal moment in British history. Yet it was short-lived, with the ideological baton passing to a group of New Right evangelists who proclaimed, falsely as it turned out, that a stiff dose of inequality would drive economic progress. As Sir Keith Joseph, a key adviser to Margaret Thatcher, put it in 1976: ‘the pursuit of income equality will turn this country into a totalitarian slum.’ From that point, egalitarianism was replaced by an entrenched bias to inequality. But instead of creating the promised economic and entrepreneurial renaissance, the new licence to get super rich simply triggered a second era of extraction and of Pareto’s ‘appropriation’ and a second wave of high poverty and inequality that is still in place.
Few other nations have applied a pro-inequality economic strategy as comprehensively as Britain and the United States. With the world’s top one per cent emitting twice the carbon emissions of the poorest half, the return of extraction also lies at the heart of the global climate crisis. Corporate leaders have exploited their growing muscle using business practices that have played havoc with pay, jobs, and livelihoods. As the American megabank Citigroup wrote in a confidential note to its clients a few years ago, the United States has long been aplutonomy, one that allows ‘the economic disenfranchisement of the masses for the benefit of the few’.
Examples of complex and carefully hidden extractive devices have included the application of monopoly power through the ruthless destruction of rivals and the rigging of financial markets, to the ‘skimming’ of trading profits – a process City traders like to call ‘the croupier’s take’ – and the engineering of company accounts. The boom in the private takeover of public companies since the millennium, from the AA to Boots and Morrisons, has enriched a generation of private equity barons, often at the expense of the survival of the targeted companies themselves. The long list of companies destroyed by such financial manipulation include ICI, GEC, BHS and Debenhams. Under extraction, economic activity becomes detached from new wealth creation, with the boost to profitability and rising corporate surpluses of recent times used to reward executives and investors rather than boost productivity. In 2019, global stock markets paid out record dividends of $1.37 trillion.
What has been at work is a form of levelling up at the top by levelling down at the bottom. While egalitarians have yet to regain the ideological high ground, one of the big questions of political economy of the next few years must be the extent to which an entrenched anti- egalitarian model of capitalism can be reformed?
Stewart Lansley is a visiting fellow at the University of Bristol, a Council member of the Progressive Economy Forum and the author of Breadline Britain, The Rise of Mass Poverty (with Joanna Mack, 2015) and The Cost of Inequality (2011).
The latest statistics from the ONS are a welcome but limited insight into what has been happening to wealth in Britain, write Arun AdvaniandHannah Tarrant. Limitations in survey response mean they will underestimate the share of wealth at the top. But while they will not tell us what has happened as a result of the pandemic, we can use them to provide an educated guess.
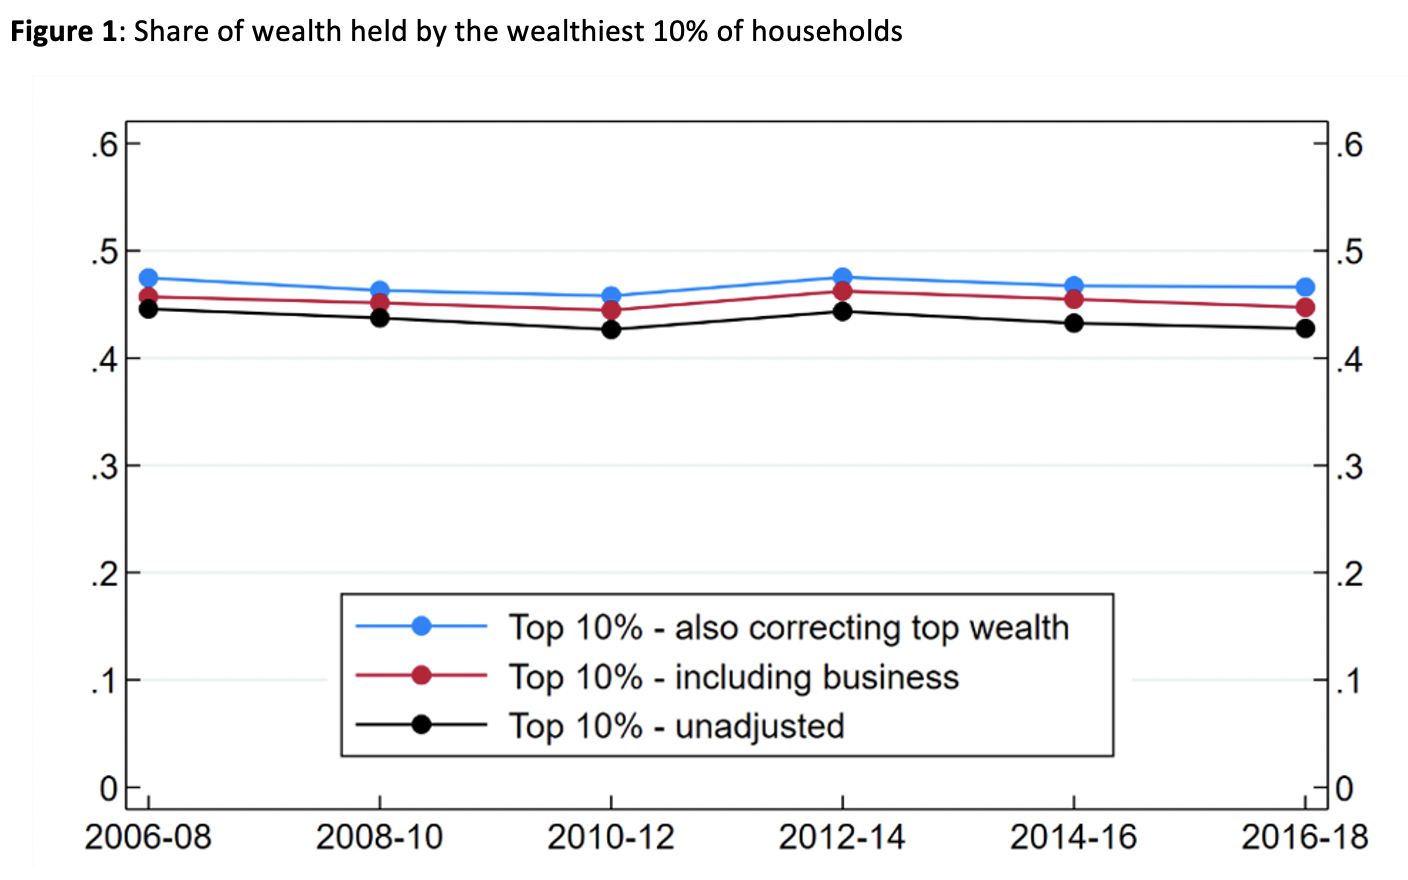
Looking back at the past 12 years of the ONS survey, the figures show that total wealth in Great Britain has risen from £10.4tn to £14.6tn (in 2016–18 prices), meaning average household wealth has risen from £402,100 to £564,300. Over the same period, the share of all wealth held by the wealthiest 10% of households has risen very slightly, from 44% to 45%. However, there are two problems with these figures. First, they do not include business wealth, which is an important source of wealth for the wealthiest households. Second, they substantially under-record the total wealth held by wealthy households, since, unsurprisingly, the very wealthy do not tend to respond to such surveys.
Adjusting the data to account for business wealth – which is measured in the survey but excluded from official statistics – we find that total wealth in Great Britain is £0.7tn higher in 2016–18. This is about 5% of the current estimate, and the proportional underestimation has been similar back to 2010–12. After adding in wealth observed in the Sunday Times Rich List, and using a statistical approach to correct for the under-representation of other wealthy households, total wealth is higher still, by £0.5tn in 2016–18. Total GB wealth is therefore underestimated in the ONS figures by about 8%.
Top wealth is higher than officially reported
After making these adjustments, the level of inequality is also higher (Figure 1). Adding business wealth into the calculation, the share of wealth owned by the wealthiest 10% of households actually rises significantly, by two percentage points. Consistent with the ONS figures, this has remained broadly steady over the period. Correcting for missing wealth at the top, we find the share of wealth going to the top 10% is further increased slightly, to around 47%, and still flat.
Notes: Constructed using data from the Wealth and Assets Survey (WAS) and the Sunday Times Rich List (STRL). ‘Including business’ adds business wealth to the ONS measure of wealth used in official statistics. ‘Also correcting top wealth’ additionally includes the wealth from the STRL and a ‘Pareto correction’ for under-reported wealth among the wealthiest households. See Advani Bangham and Leslie (2021) and Advani Hughson and Tarrant (2021)for details of the correction method. Top shares are measured at household level, consistent with the ONS.
Political movements after the financial crisis, and the work of economists like Thomas Piketty, have favoured looking at wealth concentration among smaller groups – specifically the top 1% wealthiest households. The ONS does not provide figures for this group. Constructing this measure ourselves, we see the importance both of including business wealth and of correcting for under-coverage at the top. Together, these adjustments add around 55% (6 percentage points) to the share of wealth owned by the top 1% in 2016–18 (Figure 2).
Notes: same as for Figure 1.
Other inequalities in wealth
There are also important demographic differences in wealth holdings that are worth highlighting. Men typically have higher levels of wealth: they hold almost 40% more wealth than women, on average. Wealth is concentrated among older individuals. This is partly because individuals close to retirement have had their whole working life to save, but they also benefited ‘from both benign economic developments (such as rapid rises in the value of their homes, generous occupational pension provision and decades of healthy wage growth) and generous government policies (such as free university tuition, big tax breaks for pension saving and capital gains on main homes, and the ‘triple lock’ on the state pension)’.
Wealth differences between households from different ethnic groups are stark: households whose ‘Household Reference Person’ (HRP, the main respondent to the survey) is of white ethnicity are four times more likely to have wealth in excess of £500,000 than households with a black African HRP. There are important differences in household wealth portfolios too: Pakistani and Indian households are less likely to hold pension wealth, with home ownership being more important in their asset holdings.
Previous analysis by the ONShighlights significant regional variation in household wealth. Median wealth is more than 2.5 times higher in the South East compared to the North East. This variation can largely be explained by differences in house prices, with changing house prices contributing to a growing divergence in wealth levels across regions.
Wealth trends since the pandemic
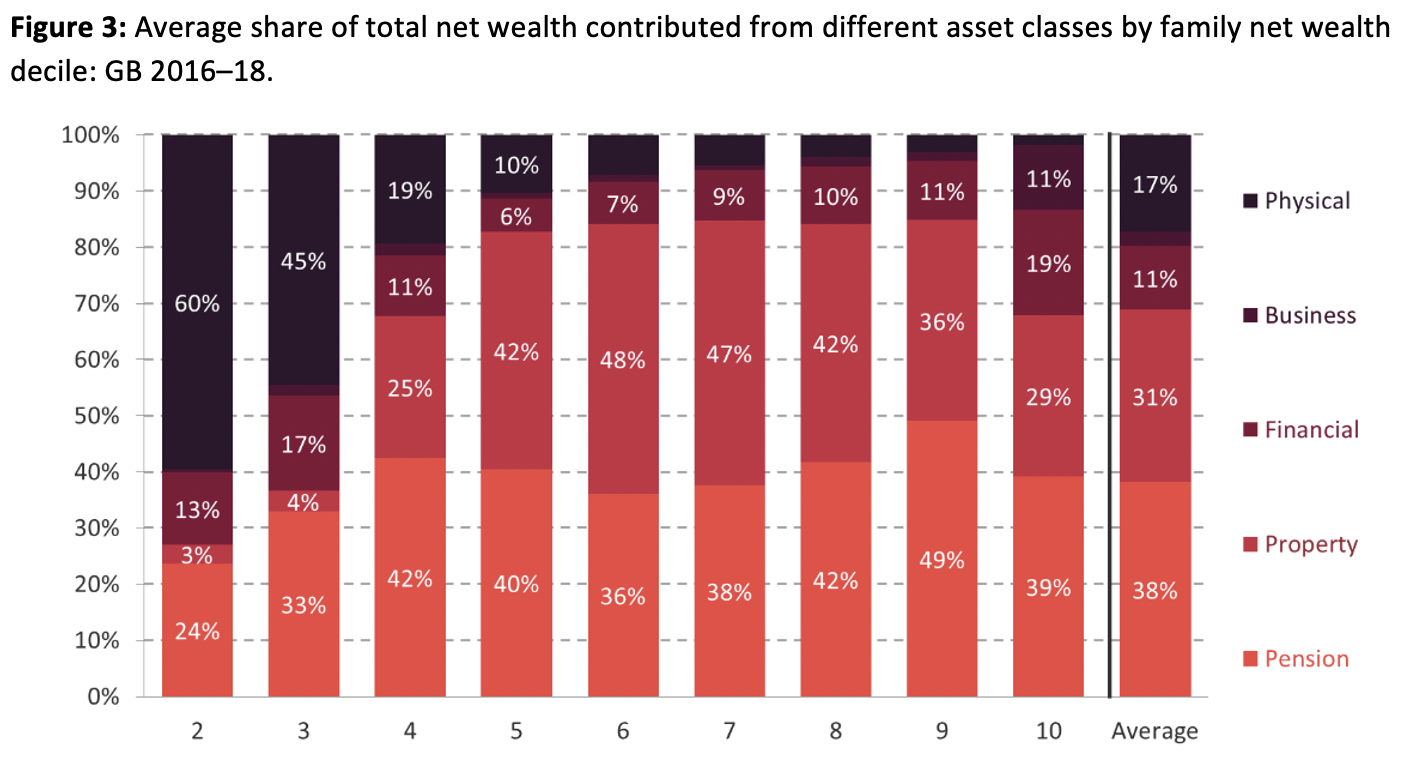
Although these latest figures will not provide direct information on what has happened to wealth since the start of the pandemic, a look at the historic survey data does provide some insight. Dividing the population up into deciles, there are clear differences in asset holdings across the distribution. We know that the average house price rose by 16% between the start of the pandemic and October 2021, and these gains were middle-weighted (Figure 3). Falling interest rates also increase the value of pensions, which are similarly middle-weighted. Meanwhile, stock market growth of around a third since the pandemic lows has disproportionately benefited richer households, though the impact of the pandemic on private businesses is less easy to measure. COVID-19 has also led to those at the bottom of the distribution, who experienced the biggest hit to their savings, falling further behind the rest.
What does this mean for the effects of the pandemic on wealth inequality? Overall, the wealthiest have clearly gained most in cash terms over the pandemic. But apart from among the super-wealthy – where there has been very rapid wealth growth – the effect on wealth concentration is likely to be less visible because there are large gains relative to initial wealth for those in the middle as well as those at the top.
____________________
About the Authors
Arun Advani is Assistant Professor in the Department of Economics at the University of Warwick.
Hannah Tarrant is Research Officer in the International Inequalities Institute at LSE.