Without reform, the funding model for the Work Programme is set up to fail ESA claimants

The government’s Work Programme, whereby providers are paid on a results basis, is not fit for purpose and risks failing Employment and Support Allowance (ESA) claimants. Drawing on new research, Timothy Riley explains the problems with the funding model. In essence, getting the minimum performance benchmarks wrong creates a vicious circle of lower funding leading to lower performance, leading to still lower funding. He argues for a way forward that would cost no more than the government had planned.

The Work Programme is the government’s flagship national employment programme. It is substantially different from previous programmes, both in terms of its larger scale and the way it is commissioned. It is delivered by a range of (primarily private sector) providers who are largely paid on a payment by results basis, the results they are paid for being sustained periods in work for customers. The payment model differs for different groups of customers based in part on the benefits they claim, with job outcomes for customer groups considered to be further from the labour market being associated with larger payments.

Unfortunately, recent performance data has shown that whilst the Work Programme is performing better for the main Jobseeker’s Allowance (JSA) payment groups, it is still well below the Department for Work and Pensions’ expected minimum performance levels for the Employment and Support Allowance (ESA) payment groups.

Figure 1: One-year job outcome measure – equivalent minimum benchmark compared to actual, by participant group (Jun 2011–Dec 2012 referrals)

Riley fig 1

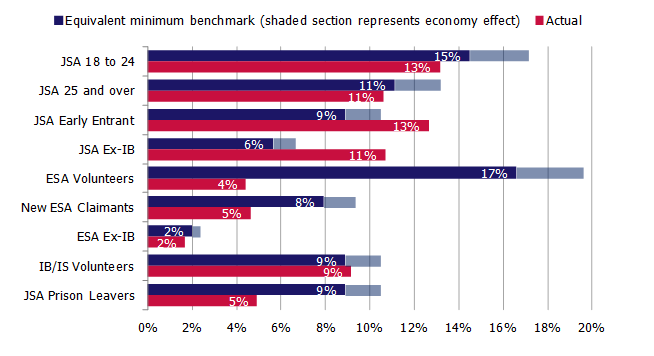
Source: DWP: Information, Governance and Security Directorate; Inclusion calculations. Average weighted by monthly referral numbers.

The Centre for Economic and Social Inclusion recently published a new report, Making the Work Programme work for ESA claimants, which sets out the problems with the funding model for Employment and Support Allowance claimants and what could be done to fix it. The report is a part of a wider project called Fit for Purpose, supported by 22 organisations and looking at the future of employment support for people with health conditions and disabilities. The final report will be available in the summer.

Specifically, we argue that a toxic mix of a weak economy, lower than expected referrals to the programme, changes to the rules on who is referred, provider under-performance and setting the targets too high in the first place have combined to lead to big shortfalls in funding and support for those on the programme.

Our calculations suggest that around 11% of ESA claimants that are required to take part in the Work Programme would have achieved a ‘job outcome’ if the Work Programme had not been introduced. The DWP, however, set their estimate at 15%. These targets have been missed in every contract, and as a consequence – because the Work Programme is a ‘payment by results’ programme – funding to support ESA claimants has been substantially lower than anticipated.

Of course, you could see this as a policy success: performance has been below expectations but the DWP has not had to pay so much to providers – so the risk of failure has been successfully transferred away from tax payers. But this would be a pretty short-sighted view. The state still picks up the tab through the benefits bill, and lower funding means more people out of work for longer and receiving less support.

We argue that getting the minimum performance benchmarks wrong risks a vicious circle of lower funding leading to lower performance, leading to still lower funding. In a sense, this means that the funding model has been set up to fail – with lower outcome payments, and therefore lower funding overall, hard-wired into the contracts.

We estimate that the money available to providers to deliver services to ESA claimants (based on DWP spend on ESA customers) is likely to be about 40% lower than was originally planned, with DWP likely to spend on average £690 per ESA claimant compared to an estimated £1,170 when the programme was designed. And this is going to get worse: as of April 2014 there are no more ‘attachment payments’ paid to providers when customers join the Work Programme, meaning that at current performance the DWP will pay providers on average only £550 per participant – which needs to cover two years of support.

When these figures are grossed up for the whole programme, taking into account lower referral numbers as well as lower performance, we estimate that the government will invest less than half of what it intended to on supporting ESA customers through the Work Programme – with spending around £350 million compared to the £730 million expected.

In the event, we find evidence that Work Programme providers are actually spending a bit more than they receive from DWP on ESA participants, in order to maintain some levels of service. In effect they are cross-subsidising from outcome payments for Jobseeker’s Allowance participants. Whilst this may be helping to paper over the problems with the payment model, it is clearly neither satisfactory nor sustainable in the longer term.

Our report sets out an alternative model that we argue should be implemented for the remainder of the programme. This new funding model is based on four key assumptions:

  • That spending should be restored for new participants to the same level as was originally intended – but foregoing the ‘savings’ that have already been banked by the Government;
  • That in return for increasing funding we should expect increased performance;
  • That the model should remain strongly outcome-based, so that risk is shared between the taxpayer and those providing services – in our proposal, around three quarters of funding would be linked to getting and sustaining jobs; and
  • That funding should be highest for those that need the most support (and specifically, those who used to claim Incapacity Benefit).

Our proposed payment model is below.

Proposed Work Programme payment model for ESA claimants

PG5 – ESA Volunteer

PG6 – ESA Flow

PG7 – ESA ex-IB

Attachment payment

£350

£350

£350

Job entry payment

£600

£900

£1,250

Job outcome payment (three months in work)

£1,150

£1,400

£4,000

Maximum job sustainment payment*

£2,300

£4,700

£9,620

Cost per attachment

£1,018

£1,181

£1,413

* Same overall levels as current model, but paid over 9 months after job outcome payment.

Without reform, in our view the funding model for the Work Programme is set up to fail ESA claimants, particularly those joining over the next two years. Whilst we and many others are rightly thinking about what should come next with ‘Work Programme Mark 2’, it is critically important that the Work Programme Mark 1 works for ESA claimants. Our report shows the failings of the current payment model for ESA groups, and a way forward that is achievable and would cost no more than the government had planned.

Note:  This article gives the views of the author, and not the position of the British Politics and Policy blog, nor of the London School of Economics. Please read our comments policy before posting. Homepage image credit: Grant Kwok

About the Author

Tim RileyTimothy Riley is a Senior Researcher at the Centre for Economic and Social Inclusion. He specialises in research into labour market and skills policy, with recent projects including high profile evaluations of Lone Parent Obligations for the Department of Work and Pensions, and Want to Work for Jobcentre Plus, and has led Inclusion’s work on ethnic minority employment. @TimRiley83.

http://blogs.lse.ac.uk/politicsandpolicy/archives/41681


Do the poorest really pay the most in tax?

Authors: Stuart Adam and Mike Brewer


The Liberal Democrats have, once again, claimed that the poor pay more of their income in tax than the rich, and that this gap has got larger under Labour. But, by ignoring the fact that the poor get most of this income from the state in benefit and tax credit payments, and by overstating the extent to which indirect taxes are paid by the poor, this comparison is meaningless at best and misleading at worst.

The underlying figures come from the Office for National Statistics, and are not in dispute. As the Liberal Democrats say, in 2007-08, the poorest fifth of households had a gross annual income of £11,105 on average, and paid £4,302 a year in tax, a ratio of 38.7%. Meanwhile, at the other end of the scale, the richest fifth of households had an average gross annual income of £74,247, and paid £25,926 in tax, on average, a ratio of 34.9%. (See Table 1 of this article).

The first key point to note is that benefits and tax credits account for £6,453 of the £11,105 average gross income of the poorest fifth of households. Their original income – in other words, private income from sources such as earnings, private pensions and investments, but not that from benefits and tax credits – was an average of £4,651. So the poorest fifth of households were clearly net beneficiaries from the tax and benefit system, to the tune of £2,151 a year, on average. At the other end of the scale, the richest fifth of households received £1,666 a year in income from the state, and so they are net contributors to the Government’s coffers, to the tune of £24,259 a year, on average.

If we define “net taxes” as “taxes paid less benefits received”, then the net tax rate of the poorest fifth is -46% of their original income (or -32% of their after-tax income), with the negative number reflecting that they are net beneficiaries. At the other end, the richest fifth have a net tax rate of +33% of their original income (or +50% of their after-tax income). These figures show what one would expect: the tax and benefit system as a whole takes money from the rich, and gives it to the poor.

The combined impact of the tax and benefit system on the distribution of income seems much more enlightening than the impact of the tax system alone when talking about fairness. The Liberal Democrats’ analysis does highlight, though, that benefits and tax credits do more to reduce income inequality in the UK than the tax system.

A second difficulty with the numbers relates to the way in which indirect taxes are treated, and this affects whether they appear to be regressive or not. People who are interviewed in the sort of surveys which underpin this analysis, and who report a low current income, tend to spend a lot relative to their current income, and therefore pay a lot of indirect tax relative to their current income. But this arises because the figures are a snapshot view of indirect taxes paid in a given period as a percentage of income in the same period. In reality, much low income is temporary, and people borrow and save to smooth out their living standards; over a lifetime, individuals cannot spend more than their income. As acknowledged by the ONS (see footnote 35 here), we get a different impression of the impact of indirect taxes by ranking people by their level of spending. That shows, for example, that VAT is progressive as a percentage of spending, since zero- and reduced-rated goods (such as food, children’s clothes and domestic fuel) are necessities that are bought disproportionately by the poor. IFS researchers have written more about this issue here, although it must be noted that the ONS analysis suggests VAT is regressive even as a percentage of spending.

What about the Liberal Democrats’ second claim: that the tax system has got less redistributive over time? Following the definition we introduce above, net tax rates on the poorest fifth have gone up since 1997-98, and those on the richest fifth have fallen very slightly (the 1997-98 figures which underpin this calculation are available in Table B here. But the poorest fifth have seen their own private income rise faster than the richest fifth (masking the opposite trend at the very extremes of the income distribution), so this may not be a particularly enlightening comparison: net tax rates should rise as incomes rise under a progressive tax and benefit system.

A more definitive answer is provided by analysis of the impact of Labour’s tax and benefit reforms on the distribution of income, which have been strongly progressive, with the poorest households gaining, on average, and the richest households losing, on average (but with the precise amounts depending on what one considers to be a “change”). It is also clear that these changes acted to dampen down what would otherwise have been a large rise in inequality.

Even on the Liberal Democrats’ peculiar definition, a natural follow-up is to wonder whether the tax system would get any less regressive over time under their policies? IFS researchers will provide a fuller assessment of that after their manifesto has been published. It is reasonably clear that the reforms to capital gains tax and the new mansions tax should increase the tax burden on the rich, but it is less clear that the proposal to increase the income tax personal allowance to £10,000 will help many of the poorest households, as the poorest fifth of households will contain those with incomes too low to pay income tax. (In any given year, one third of adults do not pay income tax and one quarter of adults live in a family where no-one pays income tax). The largest beneficiaries of the higher personal allowance will be families with two earners (where both earn less than £100,000).

http://www.ifs.org.uk/publications/4813


Whose recovery is this? That’s the great election question

If competition over living standards for low and middle earners does become the next battleground, that’s cause for celebration.

Exceptionally unpleasant propaganda seeps out of the Department of Work of Pensions. In the past, the DWP press operation was always reasonably straight under both Tory and Labour governments, following normal civil service practice. Whitehall press officers promoted their ministers’ policies. But I have never known this degree of politicisation.

This week the DWP put out a press release on benefit fraud, not attached to new figures or anything in particular. It offered a string of juicy anecdotes of disgraceful excuses used by cheats: “A benefit fraudster claiming his wife was really his sister and one saying she needed the cash for satellite TV are both examples of some of the oddest excuses DWP benefit fraud investigators have heard over the last year. One claimant – using a fake ID – said her skin colour had changed after a road accident, one man blamed his evil twin, while another claimed she wasn’t in a relationship but just had a three-night stand resulting in three children over five years.” Every magistrate hears idiotic excuses from stupid criminals, but this is the DWP’s unsubtle nudge that all claimants are fraudsters beneath the skin.

I spotted the story in other papers, but never saw the press release and it’s not on the DWP website, which is odd. I asked a senior press officer who said airily, “Oh it was just lighthearted, one of those end of recess stories.” Who was it sent to? I didn’t get one, did anyone at the Guardian? “No, I don’t think anyone did.” That’s how Iain Duncan Smith and Lord Freud set about poisoning public opinion, their one success.

“Hardworking taxpayers lost an outrageous £1.2bn in benefit fraud last year,” it says, without adding that DWP figures show a fraud rate of 0.7% – less than average for private companies and retailers. Vigilance against fraud is essential for public trust in social security – but these ministers deliberately undermine that trust: one good anecdote is worth shed-loads of statistics.

Why this now? The clue is in a quote from Lord Freud: “Universal credit will close the gaps in the welfare state that cynical benefit cheats try to take advantage of. The new benefit will reduce fraud by £200m a year when rolled out fully.” This was put out just ahead of the National Audit Office’s excoriating report on universal credit, which specifically warns that the new IT system cannot identify potentially fraudulent claims, so manual checks have to be done instead, but “such checks will not be feasible or adequate once the system is running nationally”. There must be some degree of misrepresentation that a permanent secretary should refuse to sanction.

I have lost count of the statements and speeches where Duncan Smith and Freud have sworn blind everything was on track and on budget. I have never known so much whistleblowing from within a department about the failing system, the chaos, the people sitting around doing nothing. The NAO complains about a “fortress culture”, and indeed serial denial continues to cover the chaos with bluster, diverting attention with smears against claimants. If universal credit collapses or is delayed to beyond the blue yonder, it will be a shame that a project every government considers, but shies away from in its enormity, is wrecked by incompetence, arrogance and a political imperative to rush. Combining the records of HMRC and DWP so everyone is assessed on what to pay or receive in tax and benefits according to real-time changes in income or family circumstances is the gold standard, especially for those in and out of temporary jobs.

But this delivery system doesn’t define the generosity of benefits within it. UC’s reputation may be damaged when Duncan Smith’s deep benefit cuts mean it won’t, as promised, ensure working extra hours always pays more: people will in fact still lose an average 65p in every extra pound they earn. Duncan Smith may now find he is even starting to lose public support for benefit bashing, as the next British Social Attitudes survey may suggest softening public sympathies.

The elephant-sized problem of the benefit budget lies far outside the narrow remit of the DWP and its petty spite. The ineluctable rise in the need for state support is driven by the plunge in pay. The Resolution Foundation’s report this week, Low Pay Britain 2013, described the growing gap in a two-tier workforce, as managerial and professional pay surges ahead while a million more fall into low pay, below the £7.45 an hour living wage. Britain has suffered the biggest fall in working incomes in the G7 countries, with half the working population losing an average £1,500. There has been nothing like this in living memory.

Here’s what’s happened: if since its 1999 introduction, the minimum wage had kept pace with FTSE 100 directors, it would now be £19 an hour. Instead, it keeps falling further behind. The share of GDP that goes into pay continues to fall, as more is taken out as profit. In the Commons debate this week on living standards, Tory speakers one after another boasted of 1.3m new jobs – but a third are part-time and a third are temporary, with a million people on zero-hour contracts. They boasted of raising the income tax threshold – but low-paid families are still £890 worse off from cuts than they gain in tax.

Rachel Reeves made a good speech as one Labour MP after another rose to tell of the million more claiming housing benefit, the soaring cost of childcare, rising rents, mounting debts due to uncertain pay or sudden benefit withdrawal, and food banks struggling to cope.

Labour’s analysis is strong; the facts show a frightening trajectory of ever-rising inequality. Whose recovery is this? That’s the great general election question: is it just for the upper echelons? Labour has good ideas and strong instincts – but its cautious remedies still fall short of a policy that would make a significant shift in earnings. There are signs that the Tories might jump ahead by promising sharper rises in the minimum wage, with two ministers hinting at it and a Newsnight leak.

If competition over living standards for low and middle earners does become the next battleground, that’s a cause for celebration. But if so, Labour needs to keep well ahead. Housing, childcare, jobs for the young and stopping cartel fuel and rail prices are all Labour turf, but this autumn a bolder structural policy on sinking pay has to show where Labour would lead the country in the long term, or the benefit bill will go on rising.

via Whose recovery is this? That’s the great election question | Polly Toynbee | Comment is free | The Guardian.

Conservative claims about benefits are not just spin, they’re making it up

Government ministers like Iain Duncan Smith and Grant Shapps are misrepresenting official statistics for political gain

Declan Gaffney and Jonathan Portes
guardian.co.uk, Monday 15 April 2013 15.32 BST

Conservative minister Grant Shapps has quoted a misleading statistic about the number of people on incapacity benefit dropping their claims as evidence of a broken welfare system. Photograph: Richard Sellers/Allstar/Sportsphoto Ltd
In the past three weeks, readers of mainstream UK newspapers have learned a number of things about the UK social security system and those who rely on it. They have learned that 878,000 claimants have left employment and support allowance (ESA) to avoid a tough new medical assessment; that thousands have rushed to make claims for disability living allowance (DLA) before a new, more rigorous, assessment is put in place; and that one in four of those set to be affected by the government’s benefit cap have moved into work in response to the policy. These stories have a number of things in common. Each is based on an official statistic. Each tells us about how claimants have responded to welfare policy changes. Each includes a statement from a member of the government. And each is demonstrably inaccurate.

When we say inaccurate, we are choosing our words carefully. Politicians are inevitably selective in the data they choose to publicise, picking the figures that best suit whatever story they want to tell. This can mean that stories that are technically accurate can nonetheless be potentially misleading. Within reasonable limits that is in itself neither improper nor unethical: indeed, it is virtually unavoidable. But here are some examples that are not just misleading: they assert that official government statistics say things they do not.

First, the claim that “more than a third [878,000] of people who were on incapacity benefit [who] dropped their claims rather than complete a medical assessment, according to government figures. A massive 878,300 chose not to be checked for their fitness to work [our italics].” For the Conservative party chairman, Grant Shapps, the figures “demonstrate how the welfare system was broken under Labour and why our reforms are so important”.

In fact, every month, of the roughly 43,000 people who leave ESA, about 20,000 have not yet undergone a work capability assessment (WCA); a number that over four years or so adds up to the headline 878,000. There is no mystery about this: there is an inevitable gap between applying for the benefit and undertaking the WCA. During that time, many people will see an improvement in their condition and/or will return to work (whether or not their condition improves). DWP research has shown that overwhelmingly these factors explain why people drop their claims before the WCA; it also showed that it was extremely rare for claimants not to attend a WCA. In stating, in effect, that official figures showed the opposite of this, the story was simply wrong.

Iain Duncan Smith’s assertion about a surge in DLA claims turns on the fact that DLA is being abolished for new claims and replaced with a new benefit, personal independence payment (PIP), for which most claimants will require a face-to-face assessment (for DLA, other forms of medical evidence could be used to support claims). He said: “We’ve seen a rise [in claims] in the run-up to PIP. And you know why? They know PIP has a health check. They want to get in early, get ahead of it. It’s a case of ‘get your claim in early’.”

Some very specific figures were cited: “In the north-east of England, where reforms to disability benefits are being introduced, there was an increase of 2,600 in claims over the last year, up from 1,700 the year before, the minister told the Daily Mail. In the north-west, there were 4,100 claims for the benefits over the past 12 months, more than double the 1,800 in the previous year, he said.”

But these figures, to be found on DWP’s website, in fact represent the change – successful new claims minus those leaving the benefit – in the total DLA caseload from August 2011 to August 2012, crucially including pensioners and children who are not affected by the change from DLA to PIP. They do not constitute even indicative evidence of a DLA “closing down sale”. So what happens if we look at new claims, or indeed the total caseload, for those (between 16 and 64) who will be actually affected by the change? In fact, both fell, in both regions, between those two dates. These falls – well within the normal quarterly variation – tell us little, except to show conclusively that Duncan Smith’s statements are supported by no evidence that he has offered whatsoever.

Finally, the coalition’s flagship “benefit cap”. On this occasion, not only did Duncan Smith misrepresent what his own department’s statistics meant, but he chose to directly contradict his own statisticians, claiming: “Already we’ve seen 8,000 people who would have been affected by the cap move into jobs. This clearly demonstrates that the cap is having the desired impact.”

But the official DWP analysis, from which the 8,000 figure is drawn, not only does not say this, it says the direct opposite: “The figures for those claimants moving into work cover all of those who were identified as potentially being affected by the benefit cap who entered work. It is not intended to show the additional numbers entering work as a direct result of the contact [their emphasis].”

As DWP analysts know only too well, people move off benefits into work all the time. Unless it is shown that these flows have increased for those affected, and by more for them than for other claimants – and no such analysis has yet been published, either by DWP or anybody else – we know nothing about whether the policy has had any impact (this claim is now being reviewed by the UK statistics authority).

None of this should be taken as comment on the merits of the policies in question. But these misrepresentations of official statistics cross a line between legitimate “spin”, where a government selects the data that best supports its case, and outright inaccuracy.

Public cynicism about official statistics is often misplaced – the UK, like most democracies, strictly limits the ability of governments to influence the production and dissemination of official data, often, no doubt, to the frustration of ministers. These restrictions on what government can do with official data are an unsung but essential element in modern democratic governance. When government seeks to get around these limitations by, in effect, simply making things up, this is not just an issue for geeks, wonks and pedants – it’s an issue for everyone.

• This article was amended on 19 April 2013. The original said 130,000 people leave employment and support allowance every month; that is in fact how many people leave ESA each quarter.