Tag: ConDem economy debt government
Tony Blair: Labour must search for answers and not merely aspire to be a repository for people’s anger
The centre has not shifted to the left, says Tony Blair. Labour must resist the easy option of tying itself to those forces whose anti-Tory shouts are loudest.
The paradox of the financial crisis is that, despite being widely held to have been caused by under-regulated markets, it has not brought a decisive shift to the left. But what might happen is that the left believes such a shift has occurred and behaves accordingly. The risk, which is highly visible here in Britain, is that the country returns to a familiar left/right battle. The familiarity is because such a contest dominated the 20th century. The risk is because in the 21st century such a contest debilitates rather than advances the nation.
This is at present crystallising around debates over austerity, welfare, immigration and Europe. Suddenly, parts of the political landscape that had been cast in shadow for some years, at least under New Labour and the first years of coalition government, are illuminated in sharp relief. The Conservative Party is back clothing itself in the mantle of fiscal responsibility, buttressed by moves against “benefit scroungers”, immigrants squeezing out British workers and – of course – Labour profligacy.
The Labour Party is back as the party opposing “Tory cuts”, highlighting the cruel consequences of the Conservative policies on welfare and representing the disadvantaged and vulnerable (the Lib Dems are in a bit of a fix, frankly).
For the Conservatives, this scenario is less menacing than it seems. They are now going to inspire loathing on the left. But they’re used to that. They’re back on the old territory of harsh reality, tough decisions, piercing the supposed veil of idealistic fantasy that prevents the left from governing sensibly. Compassionate Conservatism mattered when compassion was in vogue. But it isn’t now. Getting the house in order is.
For Labour, the opposite is true. This scenario is more menacing than it seems. The ease with which it can settle back into its old territory of defending the status quo, allying itself, even anchoring itself, to the interests that will passionately and often justly oppose what the government is doing, is so apparently rewarding, that the exercise of political will lies not in going there, but in resisting the temptation to go there.
So where should progressive politics position itself, not just in Britain but in Europe as a whole? How do we oppose smartly and govern sensibly?
The guiding principle should be that we are the seekers after answers, not the repository for people’s anger. In the first case, we have to be dispassionate even when the issues arouse great passion. In the second case, we are simple fellow-travellers in sympathy; we are not leaders. And in these times, above all, people want leadership.
So, for Britain, start with an analysis of where we stand as a country. The financial crisis has not created the need for change; it has merely exposed it. Demographics – the age profile of our population – technology and globalisation all mean that the systems we created post-1945 have to change radically. This is so, irrespective of the financial catastrophe of 2008 and its aftermath.
Labour should be very robust in knocking down the notion that it “created” the crisis. In 2007/2008 the cyclically adjusted current Budget balance was under 1 per cent of GDP. Public debt was significantly below 1997. Over the whole 13 years, the debt-to-GDP ratio was better than the Conservative record from 1979-97. Of course there is a case for saying a tightening around 2005 would have been more prudent. But the effect of this pales into insignificance compared to the financial tsunami that occurred globally, starting with the sub-prime mortgage debacle in the US.
However, the crisis has occurred and no one can get permission to govern unless they deal with its reality. The more profound point is: even if it hadn’t happened, the case for fundamental reform of the postwar state is clear. For example:
What is driving the rise in housing benefit spending, and if it is the absence of housing, how do we build more?
How do we improve the skillset of those who are unemployed when the shortage of skills is the clearest barrier to employment?
How do we take the health and education reforms of the last Labour government to a new level, given the huge improvement in results they brought about?
What is the right balance between universal and means-tested help for pensioners?
How do we use technology to cut costs and drive change in our education, health, crime and immigration systems?
How do we focus on the really hard core of socially excluded families, separating them from those who are just temporarily down on their luck?
What could the developments around DNA do to cut crime?
There are another 20 such questions, but they all involve this approach: a root-and-branch inquiry, from first principles, into where we spend money, and why.
On the economy, we should have one simple test: what produces growth and jobs? There is roughly $1trn (£650bn) of UK corporate reserves. What would give companies the confidence to invest it? What does a modern industrial strategy look like? How do we rebuild the financial sector? There is no need to provide every bit of detail. People don’t expect it. But they want to know where we’re coming from because that is a clue as to where we would go, if elected.
Sketch out the answers to these questions and you have a vision of the future. For progressives, that is of the absolute essence. The issue isn’t, and hasn’t been for at least 50 years, whether we believe in social justice. The issue is how progressive politics fulfils that mission as times, conditions and objective realities change around us. Having such a modern vision elevates the debate. It helps avoid the danger of tactical victories that lead to strategic defeats.
It means, for example, that we don’t tack right on immigration and Europe, and tack left on tax and spending. It keeps us out of our comfort zone but on a centre ground that is ultimately both more satisfying and more productive for party and country.
You are invited to read this free preview of the upcoming centenary issue of the New Statesman, out on 11 April.
http://newstatesman100.tumblr.com/post/47687650241/tony-blair-labour-must-search-for-answers-and-not
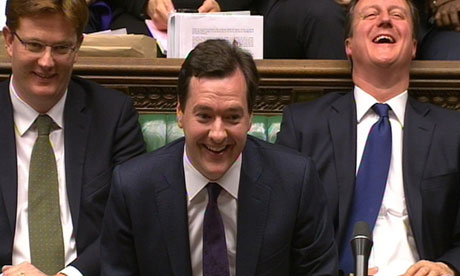
Osborne’s economic strategy has failed
These GDP figures are a disaster for the coalition government – politically as well as economically
When the rating agencies strip Britain of its AAA credit rating – as they almost certainly will – George Osborne’s strategy will be in complete tatters.
When the rating agencies strip Britain of its AAA credit rating – as they almost certainly will – George Osborne’s strategy will be in complete tatters.
The strategy has failed. The public knows it. The International Monetary Fund knows it. The credit rating agencies know it. Even George Osborne knows it, although he can’t bring himself to admit as much.
Here is a brief résumé of how things stand for the economy after two and a half years with the coalition government at the helm. National output has just contracted for the fourth quarter in the last five. The only quarter of 2012 in which the economy expanded was the one that contained the London Olympics, and unfortunately for the chancellor these sort of jamborees happen once every half century rather than once every three months.
During 2012 as a whole the economy registered no growth at all. Nothing. Zilch. A big fat zero. The level of gross domestic product is 3% below where it was when the recession started, a weaker performance than during the 1930s. Royal Bank of Scotland says the four-year performance of the economy between 2008 and 2012 is the weakest since the 1930s apart from post-war mobilisations.
Industrial production was to blame for the drop in output in the final three months of 2012, with factory output back to levels last seen in the early 1990s. Rebalancing is a pipedream. Unsurprisingly, the Treasury’s deficit reduction programme is well off track. This is an abysmal record.
Sure, there are all sorts of excuses that can be trotted out to explain away the fact that three years after the recession first ended GDP is still contracting. The crisis in the eurozone hasn’t helped. Rising commodity prices have raised business costs and acted as a brake on consumer spending.
But the government also sucked demand out of the economy by raising taxes, cutting welfare and by taking the axe to capital spending programmes. The blood-curdling rhetoric from Osborne in 2010 about Britain being a Greece in waiting had the entirely predictable effect of shredding consumer and business confidence.
So what happens next? Clearly, there is a risk that the first quarter of 2013 will also be negative. The economy is fundamentally weak and the heavy snow of the past week will not have helped.
Against this backdrop, there will be mounting pressure for further steps to get the economy moving. Ideally, action would come from the chancellor himself in the budget in the form of tax cuts and higher spending on small-scale infrastructure projects that can be started immediately.
In reality, changes to fiscal policy are likely to be small scale and cosmetic. Osborne will rely, as he has for the past two and a half years, on the Bank of England to do the heavy lifting. Further monetary easing looks inevitable, even though a combination of 0.5% bank rate and £375bn of quantitative easing has proved ineffective until now.
Politically as well as economically, these figures are a disaster for the government. It ensures the next few months will be spent debating whether the UK is heading for a triple dip and how soon the credit rating agencies will strip Britain of its AAA credit rating. When that happens – as it almost certainly will – Osborne’s strategy will be in complete tatters.
UK National Debt
The UK national debt is the total amount of money the British government owes to the private sector and other purchasers of UK gilts.
Public sector net debt was £1,039.5 billion at the end of August 2012, equivalent to 66.1% of GDP
Source: Office National Statistics publications[1] (page updated Sept 28th, 2012)
If all financial sector intervention is included (e.g. Royal Bank of Scotland, Lloyds), the Net debt was £2311.6 billion (147.3 per cent of GDP. This is known as the unadjusted measure of public sector net debt.
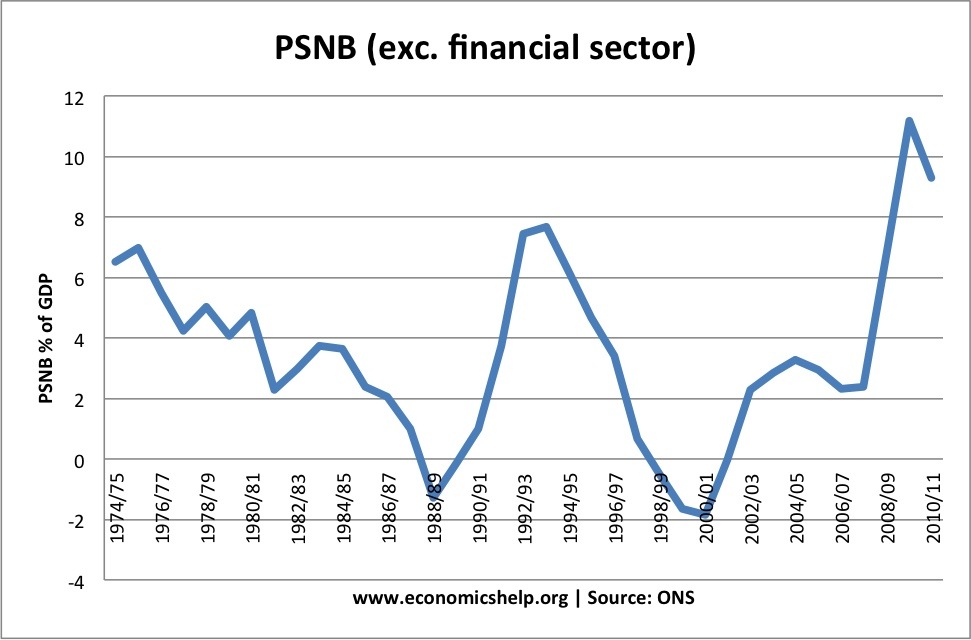
Public sector net borrowing (PSNB – annual deficit) was £125.7 billion for 2011/12; £143.2 billion or 11.% of GDP.
The equivalent OBR forecast for 2011/12 is £122 billion.
Graph Showing UK National Debt
See Graph1 at end of article
After a period of financial restraint, National debt at a % of GDP fell to 29% of GDP by 2002. Then, national debt as a % of GDP increased from 30% in 2002 to 37 % in 2007. This was despite the long period of economic expansion; it was primarily due to the government’s decision to increase spending on health and education. There has also been a marked rise in social security spending.
Since 2008, National Debt has increased sharply because of:
Economics recession (lower tax receipts, higher spending on unemployment benefits) The recession particularly hit stamp duty (falling house prices) income tax and lower corporation tax.
These cyclical factors have exposed an underlying structural deficit
Financial bailout of Northern Rock, RBS, Lloyds and other banks.
Comparison With Other Countries
Although 62% of GDP is a lot, it is worth bearing in mind that other countries have a much bigger problem. Japan for example has a National debt of 194%, Italy is over 100%. The US national debt is close to 75% of GDP. [See other countries Debt]. Also the UK has had much higher national debt in the past, e.g. in the late 1940s, UK debt was over 180% of GDP. Nevertheless, there are reasons why the UK couldn’t borrow the same sums that we did post-war.
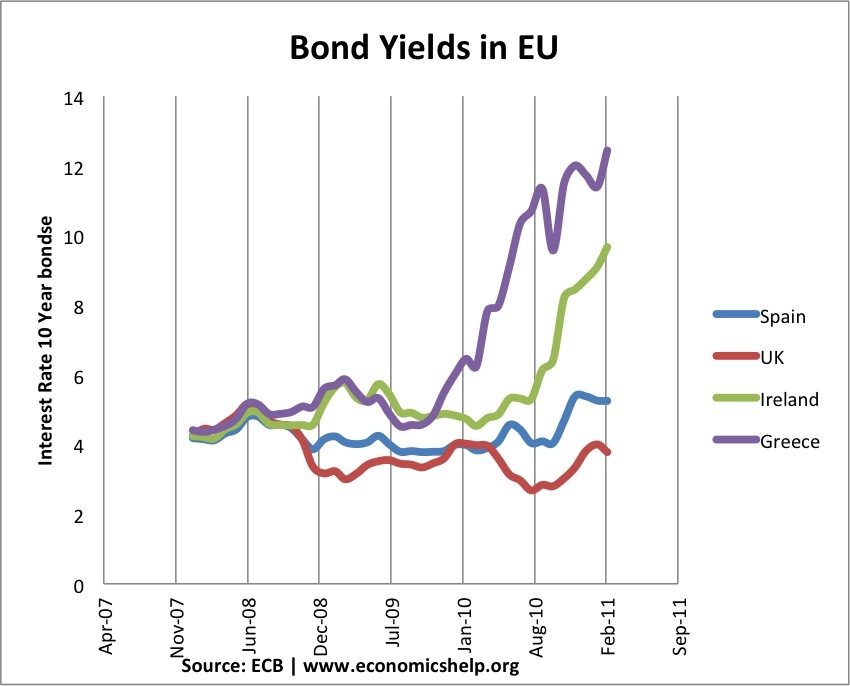
Debt and the Euro
See Graph2 at end of article
One good feature of the UK’s current debt position is that it hasn’t led to a rise in government bond yields. Countries in the Eurozone with similar debt levels have seen a sharp rise in bond yields putting greater pressure on government to cut spending quickly. However, being outside the Euro with an independent Central Bank (willing to act as lender of last resort to the government) means markets don’t fear a liquidity crisis in the UK; Euro members who don’t have a Central Bank willing to buy bonds during a liquidity crisis have been more at risk to rising bond yields and fears over government debt. See: Bond yields on European debt | (reasons for falling UK bond yields)
Cost of National Debt
The cost of National debt is the interest the government has to pay on the bonds and gilts it sells. In 2011, the debt interest payments on UK debt are anticipated to be £48.6 bn (3% of GDP). This is a sharp increased on two years ago. In 2011, the increased cost of interest payments outweighed a significant % of the governments spending cuts. (what does government spend money on)
Future of National Debt
It is estimated gross government national debt will could rise close to 100% of GDP by 2015. It is way above the government’s sustainable investment rule of 40% maximum.
However, the debt situation can be improved through:
Economic expansion which improves tax revenues and reduces spending on benefits like Job Seekers Allowance. However, the economic slowdown which has occurred since 2010 risks pushing the UK bank into a double dip recession and therefore further squeeze on tax revenues.
Improved performance of banks increases prospect of regaining financial sector intervention
Government Spending cuts and tax rises (e.g. VAT) which improve public finances. However, the big issue is the extent to which these spending cuts could reduce economic growth and therefore hamper attempts to improve tax revenues.
See: practical solutions to reducing debt without harming growth
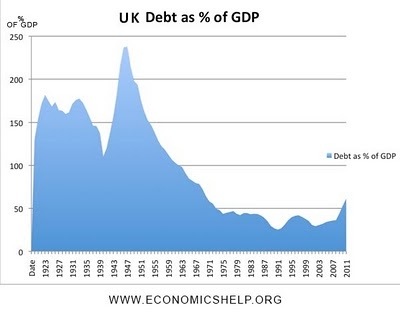
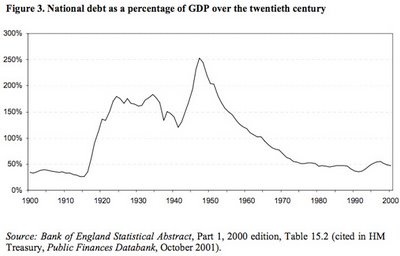
History of National Debt
UK National Debt since 1918
See Graph 3 at end of article
See also: Historical National debt
National Debt since 1922. Source: HM Treasury and UK Public Spending [1]
See Graph 4 at end of article
These graphs show that government debt as a % of GDP has been much higher in the past. Notably in the aftermath of the two world wars. This suggests that UK debt is manageable compared to the early 1950s. (note, even with a national debt of 200% of GDP in early 1950s, UK avoided default and even managed to set up the Welfare State and NHS. However, in the current climate, the UK wouldn’t be able to borrow the same as in the past. For example, private sector saving is lower, US wouldn’t give us big loan like in 1950s.See more at:
How much can a government borrow?
What are the prospects for UK debt default?
What is the Real Level of UK National Debt?
It is argued by some that the UK’s national debt is actually a lot higher. This is because national debt should include pension contributions and private finance initiatives PFI which the government are obliged to pay.
The Centre for Policy Studies (at end of 2008) argues that the real national debt is actually £1,340 billion, which is 103.5 per cent of GDP. This figure includes all the public sector pension liabilities such as pensions, and private finance initiative contracts e.t.c (and Northern Rock liabilities).
However, these pension liabilities are not things the government are actually spending now. Therefore, there is no need to borrow for them yet. It is more of a guide to future public sector debt. I don’t accept the fact that future pension liabilities should be counted as public sector debt. In 2006, the Statistics Office did change calculations to include some PFI into public sector debt figures [pdf – Treasury.gov.uk]
However, it is a sign that it will be difficult to improve finances in the future.
Another problem is that with the financial crisis, the government have added an extra £500bn of potential liabilities. Note: the Government has offered to back mortgage securities. They are unlikely to spend this money. But, in theory the government could be liable for extra debts of up to £500bn. If we include this bailout package as a contingent liability National debt would be well over 100% of GDP. However with an improvement in bank sector, the necessity for these bailouts look unlikely, unless there is a very sharp deterioration in global finance.
Forecast for National Debt
See Graph 5 at end of article
UK Debt
UK public finances at HM Treasury
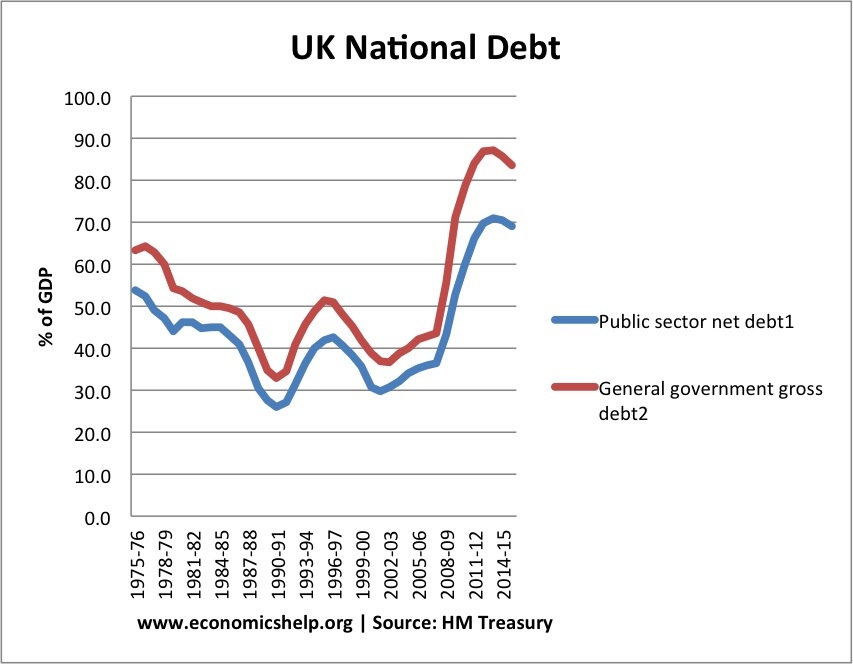
Current forecasts for UK debt predict that the UK debt to GDP ratio will peak at 71% in 2013/14
By 2015/16 there will be a fall in debt to GDP ratio to 69% of GDP
However, this forecast of debt reduction is based on relatively optimistic forecasts for economic growth. Given increased risk of economic stagnation or even double dip recession, tax revenues are likely to be lower than anticipated. If the UK does enter recession, it will be very difficult to stabilise debt to GDP ratio by 2015.
General government gross debt is a slightly wider definition of debt. It is used in the Maastricht criteria for defining debt.
Debt including Financial sector intervention
See Graph 6 at end of article
Problems of National Debt
Interest Payments. The cost of paying interest on the government’s debt is very high. In 2011 Debt interest payments will be £48 billion a year (est 3% of GDP). Public sector debt interest payments will be the 4th highest department after social security, health and education. Debt interest payments could rise close to £70bn given the forecast rise in national debt.
Higher Taxes / lower spending in the future.
Crowding out of private sector investment / spending
The structural deficit will only get worse as an ageing population places greater strain on the UK’s pension liabilities. (demographic time bomb)
Potential negative impact on exchange rate (link)
Potential of rising interest rates as markets become more reluctant to lend to the UK government.
However, Government Borrowing is not always as bad as people fear.
Borrowing in a recession helps to offset a rise in private sector saving. Government borrowing helps maintain aggregate demand and prevents fall in spending
In a liquidity trap and zero interest rates, governments can often borrow at very low rates for a long time (e.g. Japan) This is because people want to save and buy government bonds
Savage austerity measures (e.g. cutting spending and raising taxes) can lead to a decrease in economic growth and cause the deficit to remain the same % of GDP. Austerity measures and the economy | Timing of austerity
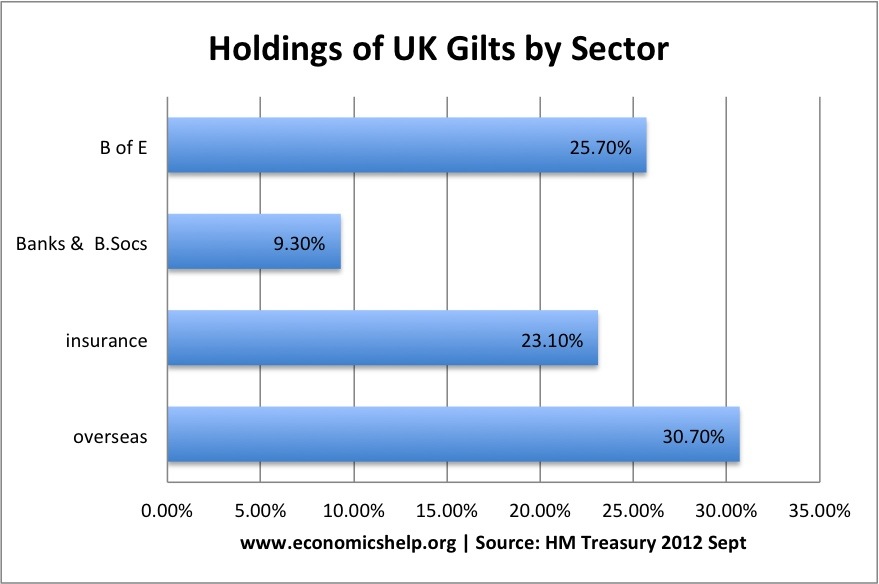
Who Owns UK Debt?
The majority of UK debt used to be held by the UK private sector, in particular, UK insurance and pension funds. In recent years, the Bank of England has bought gilts taking its holding to 25% of UK public sector debt.
Overseas investors own about 30% of UK gilts.
See Graph 7 at end of article
More at: who owns UK debt?
Total UK Debt – Government + Private
Another way to examine UK debt is to look at both government debt and private debt combined.
Total UK debt includes household sector debt, business sector debt, financial sector debt and government debt. This is over 500% of GDP.Total UK Debt
UK Budget Deficit
The UK budget deficit is the annual borrowing requirement. It is measured by public sector net borrowing.
See Graph 8 at end of article
Graph 1

Graph 2
Graph 3
Graph 4
Graph 5
Graph 6

Graph 7
Graph 8