
George Osborne’s austerity is costing UK an extra £76bn, says IMF New analysis of figures throws doubt on chancellor’s forecast
Heather Stewart
The Observer, Saturday 13 October 2012 21.08 BST
George Osborne’s drastic deficit-cutting programme will have sucked £76bn more out of the economy than he expected by 2015, according to estimates from the International Monetary Fund of the price of austerity.
Christine Lagarde, the IMF’s managing director, last week caused consternation among governments that have embarked on controversial spending cuts by arguing that the impact on economic growth may be greater than previously thought.
The independent Office for Budget Responsibility implicitly used a “fiscal multiplier” of 0.5 to estimate the impact of the coalition’s tax rises and spending cuts on the economy. That meant each pound of cuts was expected to reduce economic output by 50p. However, after examining the records of many countries that have embraced austerity since the financial crisis, the IMF reckons the true multiplier is 0.9-1.7.
Calculations made for the Observer by the TUC reveal that if the real multiplier is 1.3 – the middle of the IMF’s range – the OBR has underestimated the impact of the cuts by a cumulative £76bn, more than 8% of GDP, over five years. Instead of shaving less than 1% off economic growth during this financial year, austerity has depressed it by more than 2%, helping to explain why the economy has plunged into a double-dip recession.
Labour seized on the IMF’s intervention as a vindication of shadow chancellor Ed Balls’s argument that the cuts programme is self-defeating. “The IMF’s analysis should be a wake-up call for David Cameron and George Osborne,” said the shadow chief secretary to the treasury, Rachel Reeves. “It’s time the prime minister and the chancellor listened to the evidence, accepted their plan isn’t working and changed course.”
TUC general secretary Brendan Barber said: “The chancellor has repeatedly used the IMF as cover for his austerity strategy, despite warnings that deep spending cuts in the midst of a global turndown would make a bad situation worse. Now that the IMF has admitted spending cuts could hit the economy at least twice as hard as it previously thought, the government has all the evidence it needs to change course.”
Neal Lawson, director of left-wing pressure group Compass, said, “the cuts were never going to work, but these calculations show the effect is bigger than anyone judged. The economy isn’t suffering from government borrowing but a severe lack of demand that only the government can fix.”
Osborne told reporters in Tokyo that the IMF does not allow for the boost provided to growth by the Bank of England’s £375bn of quantitative easing. “The point I would make about their study of the fiscal multipliers is that they explicitly say they were not taking into account offsetting monetary policy action. In the UK, I would argue we have a tough and credible fiscal policy to allow for loose and accommodative monetary policy and I think that is the right combination.”
But many economists believe the dent in growth caused by austerity policies may be larger than first thought, because the financial crisis has left banks starving firms and households of credit; and with many countries cutting back simultaneously, it is harder to fill the gap created by cuts with demand for exports.
Former monetary policy committee member Danny Blanchflower said: “In a way, the surprise is that it’s taken everybody so long to work it out: Keynes knew it in the 1930s. This is the ‘long, dragging conditions of semi-slump’, and the multipliers are likely to be larger when you’ve got banks that aren’t lending and you’re coming out of the longest recession in 100 years.”
Adair Turner, chairman of the Financial Services Authority, said that the Treasury should have pumped even more into Britain’s banks during the credit crisis to leave them in a stronger state. “The recovery from recession has been far slower than most commentators and all official forecasts anticipated in 2009,” he said. “That reflects our failure to understand just how powerful are the deflationary effects created by deleveraging in the aftermath of financial crises.”
The OBR, set by Osborne to give an independent assessment of the economy, will publish a report on Tuesday explaining why it has consistently overestimated economic growth, and is expected to touch on the issue of whether the cuts are taking a greater-than-predicted toll. At its last forecast, in March, it predicted 0.8% growth this year; the IMF now expects the final figure to be -0.4%.
• This article was amended on Sunday 14 October to add the word “implicitly” to clarify how the Office for Budget Responsibility used a “fiscal multiplier” to estimate the impact of the coalition’s tax rises and spending cuts.
UK National Debt
The UK national debt is the total amount of money the British government owes to the private sector and other purchasers of UK gilts.
Public sector net debt was £1,039.5 billion at the end of August 2012, equivalent to 66.1% of GDP
Source: Office National Statistics publications[1] (page updated Sept 28th, 2012)
If all financial sector intervention is included (e.g. Royal Bank of Scotland, Lloyds), the Net debt was £2311.6 billion (147.3 per cent of GDP. This is known as the unadjusted measure of public sector net debt.
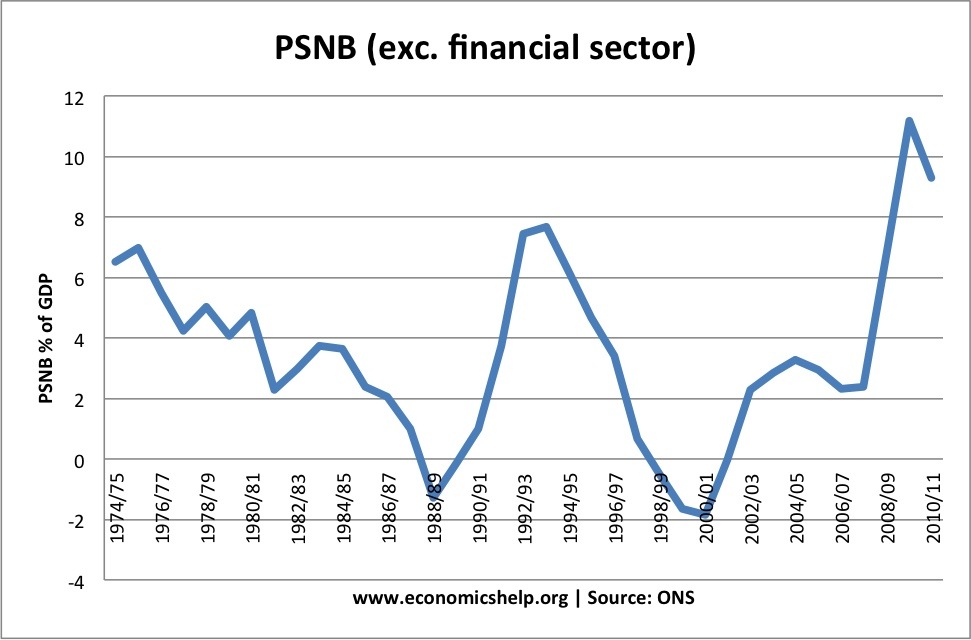
Public sector net borrowing (PSNB – annual deficit) was £125.7 billion for 2011/12; £143.2 billion or 11.% of GDP.
The equivalent OBR forecast for 2011/12 is £122 billion.
Graph Showing UK National Debt
See Graph1 at end of article
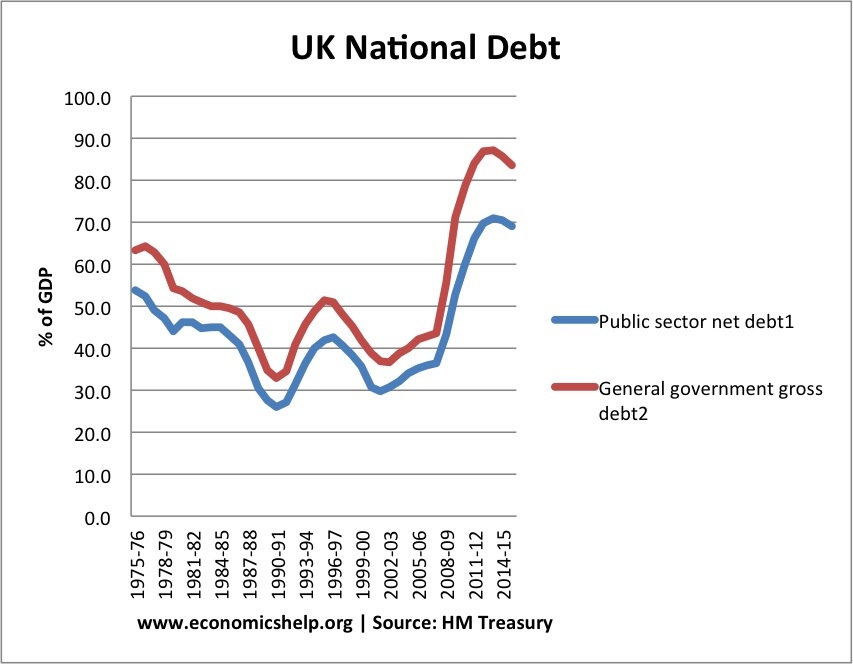
After a period of financial restraint, National debt at a % of GDP fell to 29% of GDP by 2002. Then, national debt as a % of GDP increased from 30% in 2002 to 37 % in 2007. This was despite the long period of economic expansion; it was primarily due to the government’s decision to increase spending on health and education. There has also been a marked rise in social security spending.
Since 2008, National Debt has increased sharply because of:
Economics recession (lower tax receipts, higher spending on unemployment benefits) The recession particularly hit stamp duty (falling house prices) income tax and lower corporation tax.
These cyclical factors have exposed an underlying structural deficit
Financial bailout of Northern Rock, RBS, Lloyds and other banks.
Comparison With Other Countries
Although 62% of GDP is a lot, it is worth bearing in mind that other countries have a much bigger problem. Japan for example has a National debt of 194%, Italy is over 100%. The US national debt is close to 75% of GDP. [See other countries Debt]. Also the UK has had much higher national debt in the past, e.g. in the late 1940s, UK debt was over 180% of GDP. Nevertheless, there are reasons why the UK couldn’t borrow the same sums that we did post-war.
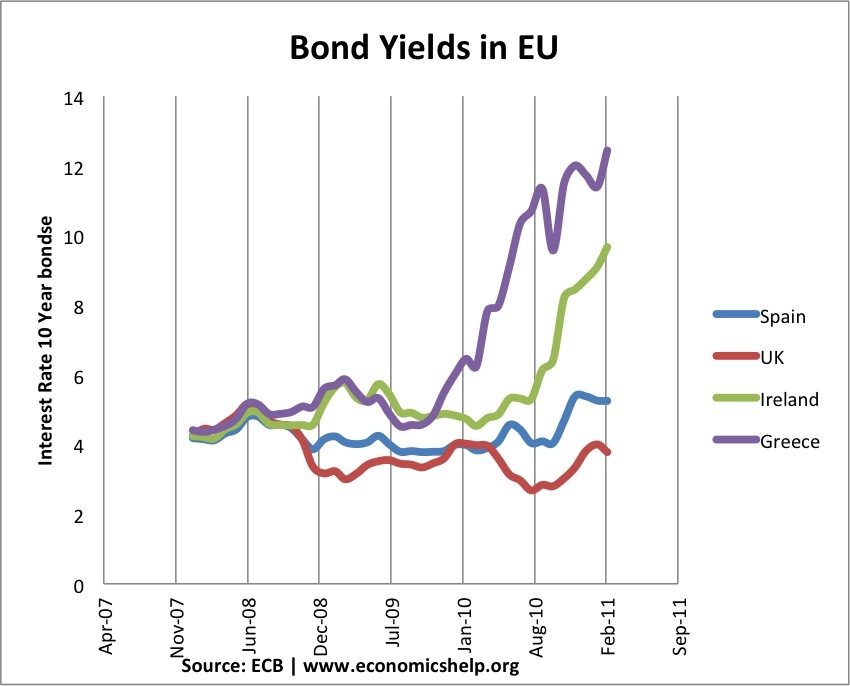
Debt and the Euro
See Graph2 at end of article
One good feature of the UK’s current debt position is that it hasn’t led to a rise in government bond yields. Countries in the Eurozone with similar debt levels have seen a sharp rise in bond yields putting greater pressure on government to cut spending quickly. However, being outside the Euro with an independent Central Bank (willing to act as lender of last resort to the government) means markets don’t fear a liquidity crisis in the UK; Euro members who don’t have a Central Bank willing to buy bonds during a liquidity crisis have been more at risk to rising bond yields and fears over government debt. See: Bond yields on European debt | (reasons for falling UK bond yields)
Cost of National Debt
The cost of National debt is the interest the government has to pay on the bonds and gilts it sells. In 2011, the debt interest payments on UK debt are anticipated to be £48.6 bn (3% of GDP). This is a sharp increased on two years ago. In 2011, the increased cost of interest payments outweighed a significant % of the governments spending cuts. (what does government spend money on)
Future of National Debt
It is estimated gross government national debt will could rise close to 100% of GDP by 2015. It is way above the government’s sustainable investment rule of 40% maximum.
However, the debt situation can be improved through:
Economic expansion which improves tax revenues and reduces spending on benefits like Job Seekers Allowance. However, the economic slowdown which has occurred since 2010 risks pushing the UK bank into a double dip recession and therefore further squeeze on tax revenues.
Improved performance of banks increases prospect of regaining financial sector intervention
Government Spending cuts and tax rises (e.g. VAT) which improve public finances. However, the big issue is the extent to which these spending cuts could reduce economic growth and therefore hamper attempts to improve tax revenues.
See: practical solutions to reducing debt without harming growth
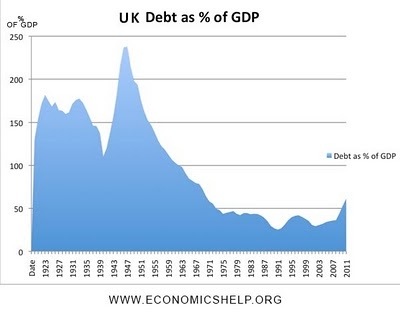
History of National Debt
UK National Debt since 1918
See Graph 3 at end of article
See also: Historical National debt
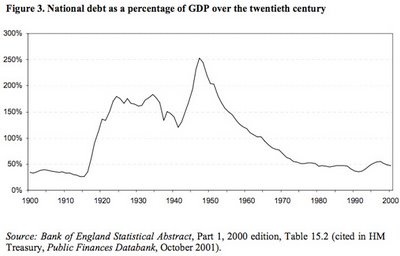
National Debt since 1922. Source: HM Treasury and UK Public Spending [1]
See Graph 4 at end of article
These graphs show that government debt as a % of GDP has been much higher in the past. Notably in the aftermath of the two world wars. This suggests that UK debt is manageable compared to the early 1950s. (note, even with a national debt of 200% of GDP in early 1950s, UK avoided default and even managed to set up the Welfare State and NHS. However, in the current climate, the UK wouldn’t be able to borrow the same as in the past. For example, private sector saving is lower, US wouldn’t give us big loan like in 1950s.See more at:
How much can a government borrow?
What are the prospects for UK debt default?
What is the Real Level of UK National Debt?
It is argued by some that the UK’s national debt is actually a lot higher. This is because national debt should include pension contributions and private finance initiatives PFI which the government are obliged to pay.
The Centre for Policy Studies (at end of 2008) argues that the real national debt is actually £1,340 billion, which is 103.5 per cent of GDP. This figure includes all the public sector pension liabilities such as pensions, and private finance initiative contracts e.t.c (and Northern Rock liabilities).
However, these pension liabilities are not things the government are actually spending now. Therefore, there is no need to borrow for them yet. It is more of a guide to future public sector debt. I don’t accept the fact that future pension liabilities should be counted as public sector debt. In 2006, the Statistics Office did change calculations to include some PFI into public sector debt figures [pdf – Treasury.gov.uk]
However, it is a sign that it will be difficult to improve finances in the future.
Another problem is that with the financial crisis, the government have added an extra £500bn of potential liabilities. Note: the Government has offered to back mortgage securities. They are unlikely to spend this money. But, in theory the government could be liable for extra debts of up to £500bn. If we include this bailout package as a contingent liability National debt would be well over 100% of GDP. However with an improvement in bank sector, the necessity for these bailouts look unlikely, unless there is a very sharp deterioration in global finance.
Forecast for National Debt
See Graph 5 at end of article
UK Debt
UK public finances at HM Treasury
Current forecasts for UK debt predict that the UK debt to GDP ratio will peak at 71% in 2013/14
By 2015/16 there will be a fall in debt to GDP ratio to 69% of GDP
However, this forecast of debt reduction is based on relatively optimistic forecasts for economic growth. Given increased risk of economic stagnation or even double dip recession, tax revenues are likely to be lower than anticipated. If the UK does enter recession, it will be very difficult to stabilise debt to GDP ratio by 2015.
General government gross debt is a slightly wider definition of debt. It is used in the Maastricht criteria for defining debt.
Debt including Financial sector intervention
See Graph 6 at end of article
Problems of National Debt
Interest Payments. The cost of paying interest on the government’s debt is very high. In 2011 Debt interest payments will be £48 billion a year (est 3% of GDP). Public sector debt interest payments will be the 4th highest department after social security, health and education. Debt interest payments could rise close to £70bn given the forecast rise in national debt.
Higher Taxes / lower spending in the future.
Crowding out of private sector investment / spending
The structural deficit will only get worse as an ageing population places greater strain on the UK’s pension liabilities. (demographic time bomb)
Potential negative impact on exchange rate (link)
Potential of rising interest rates as markets become more reluctant to lend to the UK government.
However, Government Borrowing is not always as bad as people fear.
Borrowing in a recession helps to offset a rise in private sector saving. Government borrowing helps maintain aggregate demand and prevents fall in spending
In a liquidity trap and zero interest rates, governments can often borrow at very low rates for a long time (e.g. Japan) This is because people want to save and buy government bonds
Savage austerity measures (e.g. cutting spending and raising taxes) can lead to a decrease in economic growth and cause the deficit to remain the same % of GDP. Austerity measures and the economy | Timing of austerity
Who Owns UK Debt?
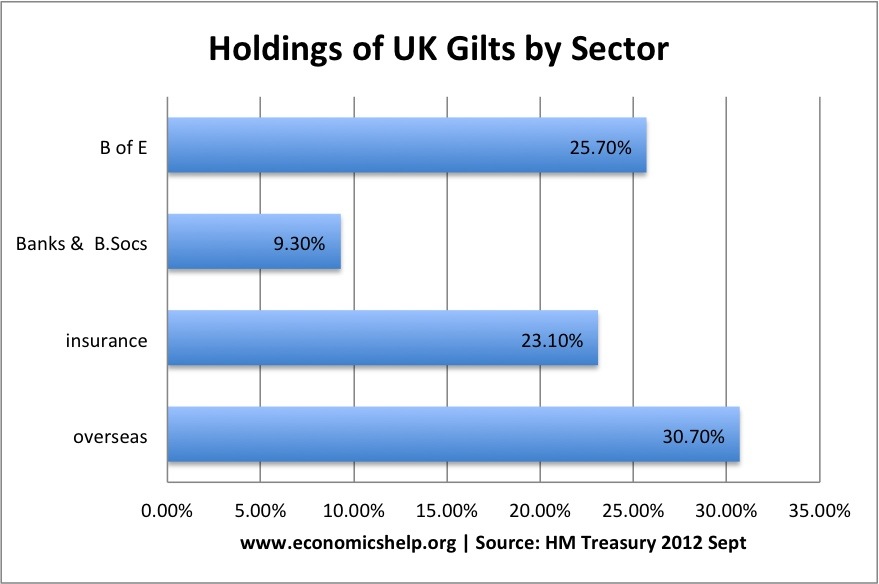
The majority of UK debt used to be held by the UK private sector, in particular, UK insurance and pension funds. In recent years, the Bank of England has bought gilts taking its holding to 25% of UK public sector debt.
Overseas investors own about 30% of UK gilts.
See Graph 7 at end of article
More at: who owns UK debt?
Total UK Debt – Government + Private
Another way to examine UK debt is to look at both government debt and private debt combined.
Total UK debt includes household sector debt, business sector debt, financial sector debt and government debt. This is over 500% of GDP.Total UK Debt
UK Budget Deficit
The UK budget deficit is the annual borrowing requirement. It is measured by public sector net borrowing.
See Graph 8 at end of article
Graph 1

Graph 2
Graph 3
Graph 4
Graph 5
Graph 6

Graph 7
Graph 8
France and it’s new 75% tax on incomes over €1,000,000
Classic front page from Libération. After the famous quote from Sarkozy
Living standards report shows bleak future of a divided Britain
Independent study suggests rich will get richer and the poor poorer as chancellor plans further £10bn of welfare cuts
The Observer, Saturday 22 September 2012 21.29 BST
Chancellor George Osborne has been accused of ‘waging war’ on Britain’s poor.
Living standards for low- and middle-income households will fall until 2020, even if the country enters a golden period of steady economic growth, according to an incendiary analysis of deepening income inequality in Britain.
The independent study, carried out for the Resolution Foundation by the Institute for Fiscal Studies and the Institute for Employment Research, paints a stark picture of a nation increasingly polarised between a poorer half whose incomes are set to fall and a top half whose living standards will continue to rise.
As the political conference season opens in Brighton this weekend with Nick Clegg’s Liberal Democrats promoting themselves as the party of “fairness” in austere times, the research will pose far-reaching questions for politicians across the spectrum. The chancellor, George Osborne, has been accused of “waging war” on Britain’s poor as he looks to cut a further £10bn from the welfare budget by 2016. But as pressure grows on the government to ease austerity measures and launch a push for growth, the new study makes clear that even a resurgent economy will not solve the problem of Britain’s increasingly divided society.
Entitled Who Gains from Growth?, the study makes clear that future prosperity for the bottom half of earners depends on a policy revolution on several fronts: increasing the number of women in work, boosting training and skills, and raising wages for the lowest paid. Without this, the report finds, a typical low-income family will see its net income fall in real terms by 15% by 2020 – down from £10,600 (at 2009 prices) to just £9,000 at the end of the decade (again at 2009 prices).
A typical household close to middle income could expect to see an income of £22,100 in 2020 – a 3% fall from £22,900 in 2009. Overall, by 2020 families who depend on benefits could expect to see an annual decline in income of 1.7%. Meanwhile, the top 50% of households can expect their living standards to grow by 0.2% a year to 2020; and faster for the most affluent. A typical middle income for a working-age couple is roughly £30,000 before tax, rising to £42,000 for a couple with two children.
The findings are all the more alarming as they are premised on generous growth projections for the period between now and 2015, averaging 1.5% a year, and average growth of 2.5% from 2015 to 2020 – levels most economists would currently regard as relatively optimistic.
Professor Mike Brewer, research fellow at the IFS, said all the signs were that with current government policies the trend would be strongly against income growth for the bottom half of households.
“This analysis confirms the strong currents that will be pushing against income growth in the next 10 years, even once a recovery in GDP takes hold,” he said. “Britain looks likely to see continuing polarisation in our labour market as more high-and low-paid jobs are created, skewing the distribution of income growth towards higher income households.
“Meanwhile, support through the tax and benefit system is set to fall over the long-term, meaning that lower income households will tend to fall behind.”
The study identifies several reasons for the deepening divide in living standards. While new jobs are being created, it finds that many are at the top and the bottom of the income scale, with few in the middle. By 2020, it says, Britain can expect 2m more jobs in high-paid professional and managerial occupations and also growth in low-skilled service roles, with more than 700,000 new positions in retail, caring and leisure. But more traditional jobs in the middle – from skilled administrative roles to skilled manufacturing – are drying up.
Gavin Kelly, chief executive of the Resolution Foundation, said: “This is a powerful wake-up call – it gives us the most detailed account to date of the bleak outlook for living standards over the next decade if we fail to tackle some of the underlying weaknesses in our economy. It suggests that millions of families will struggle, to an extent we have not seen in other periods of growth, to progress and raise their incomes. It’s particularly sobering that this outlook is based on optimistic assumptions about growth in the economy with a steadily rising number of people in employment.
“Just as importantly, the study suggests some of the positive choices that could be made that, if taken together, could make a major difference to the living standards of millions of low- and middle-income households over the next decade. It provides us with both a stark warning and the outline of an alternative path.”
In exploring possibles routes out of the crisis, the report examines what the effect would be if wages for low earners were to grow at the same rate as they did in the decade around the introduction of the national minimum wage in 1999. It also projects a future in which Britain matches the proportion of women in work achieved by the best-performing OECD countries, such as the Scandinavians, which is likely to require a big expansion of childcare provision. And on training it looks at the effects of improving intermediate skills, meaning developing vocational training.
For a typical middle income family, the effect of making all three changes would mean an extra £1,600 a year in 2020 compared to Britain’s current path.
