Stewart Lansley writes that Britain’s model of ‘extractive capitalism’ – with a small elite securing an excessive slice of the economic cake – has created a two-century-long high-inequality, high-poverty cycle, one broken for only a brief period after the Second World War.
Over the last four decades, Britain has moved from being one of the most equal of rich nations to the second most unequal (after the United States). The same period has also seen a surge in levels of poverty, with the child poverty rate more than double that of the late 1970s (figure 1).
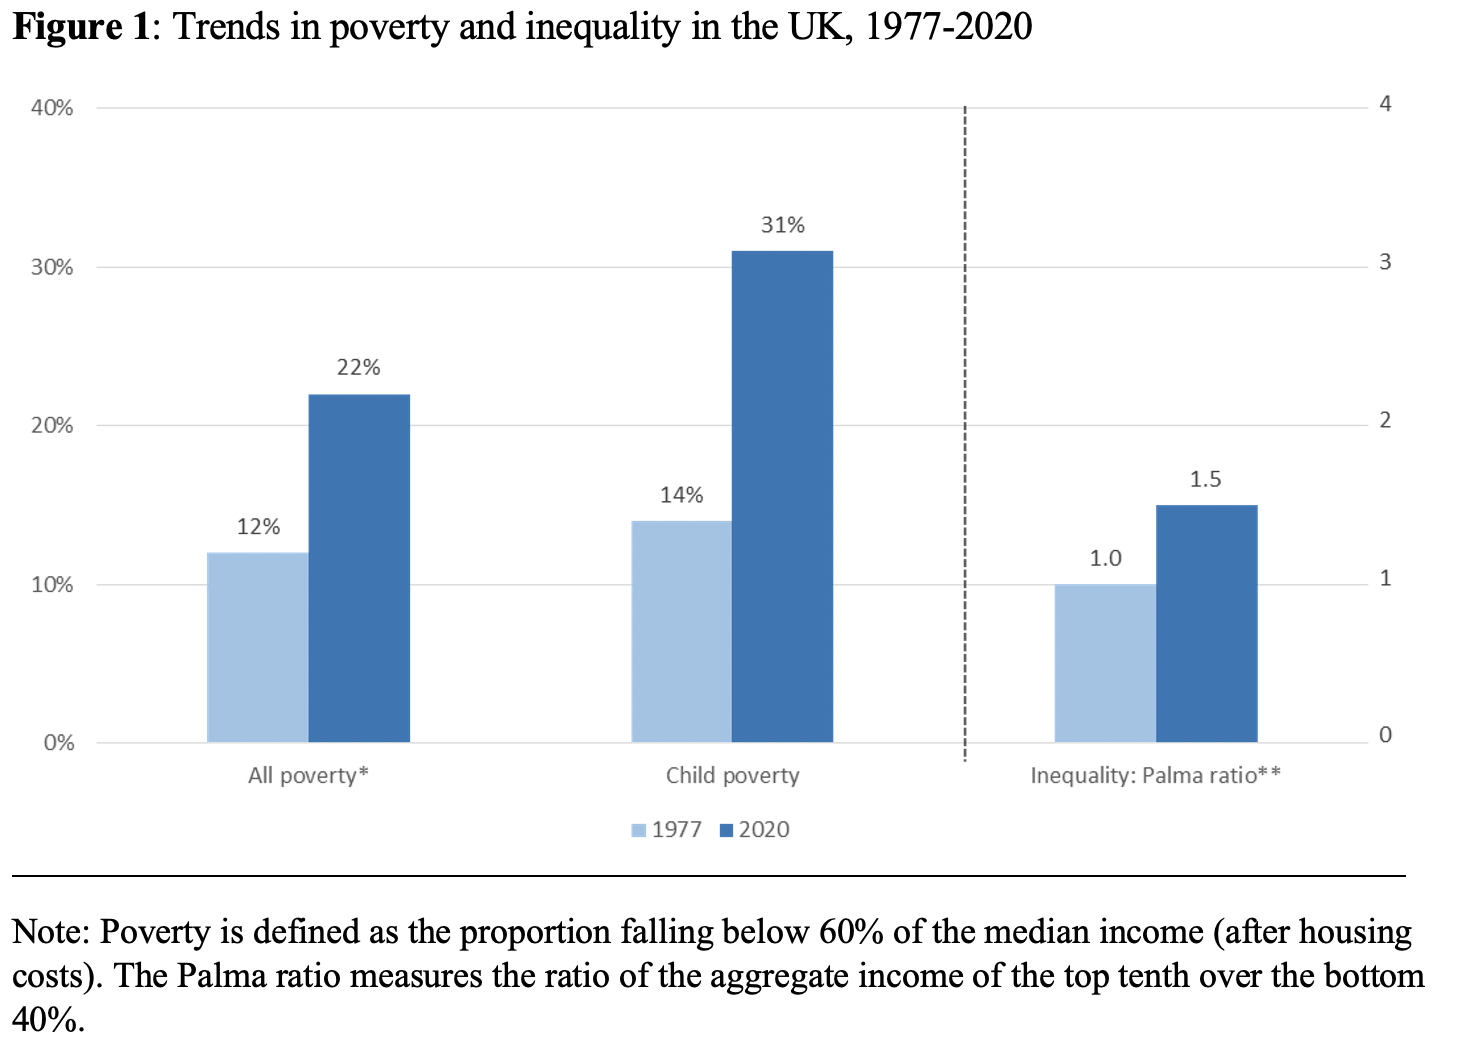
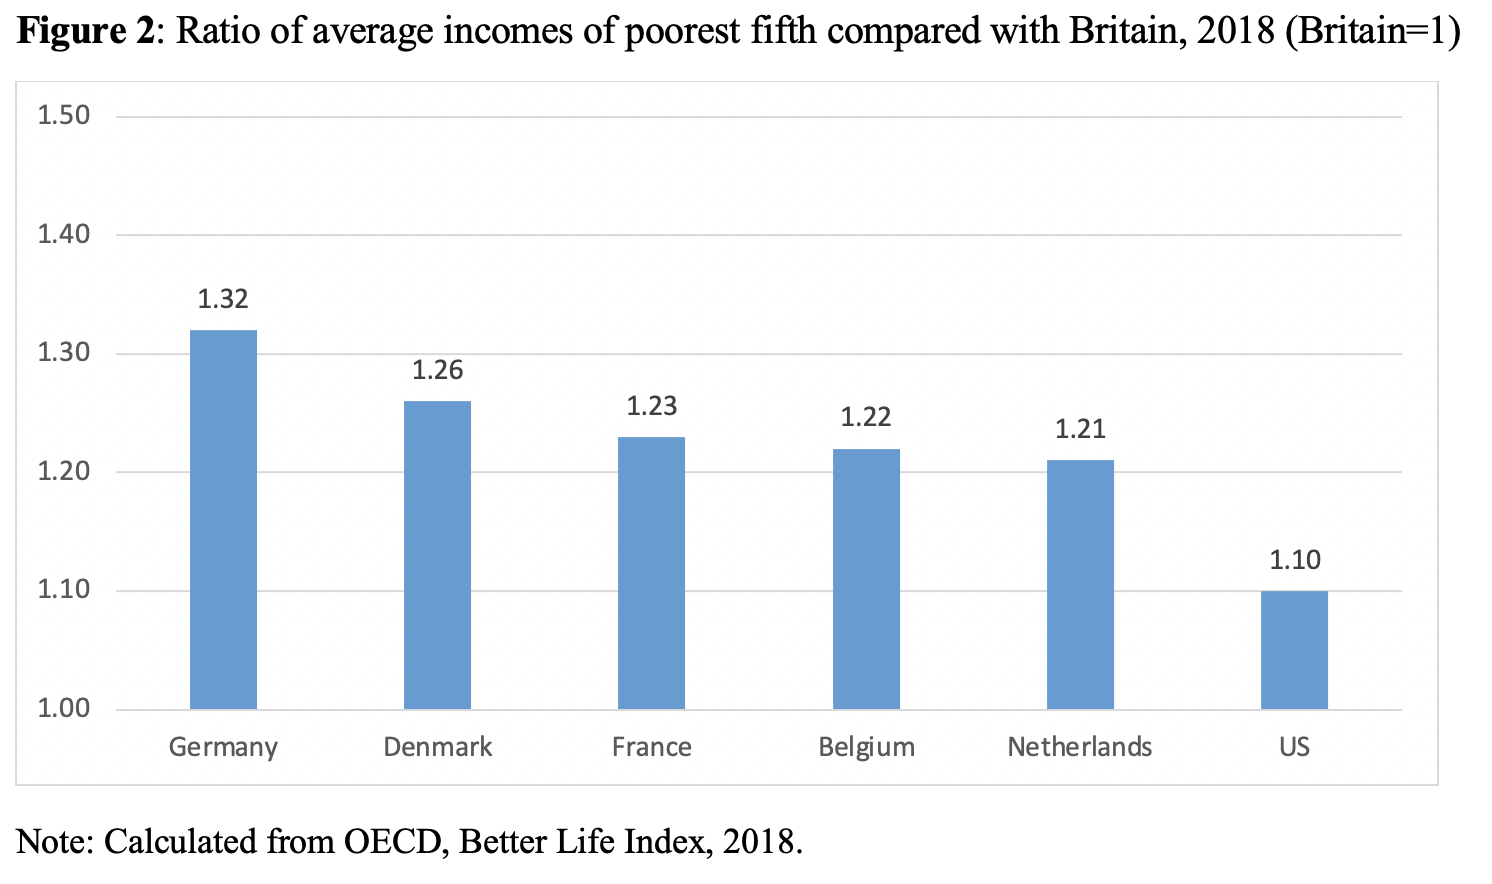
That these two key measures of social fragility have moved in line is no surprise. History cannot be clearer: poverty and inequality are critically linked. Poverty occurs when sections of society have insufficient resources to be able to afford a minimal acceptable contemporary living standard. Its scale is ultimately determined by how the ‘cake is cut’. Barring the short post-war period, Britain has been a high-inequality, high-poverty nation for most of the last 200 years, with significant consequences for life chances, social resilience, and economic strength. Because of the impact of inequality, the poorest fifth of Britons are today much poorer that their counterparts in other, more equal nations (chart 2). Germany’s poorest, for example, are a third better off than those in Britain.
Poverty and inequality levels are ultimately rooted in the outcome of the political and economic power games that play out between big business, state, and society. With the exception of the immediate post-war era, the struggles for share over the last 200 years have been won by the richest and most affluent sections of society, often with the compliance of the state.
For most of the nineteenth century, Britain was a near-plutocracy, with society run mostly by and for the richest sections of society. Colossal and heavily concentrated wealth sat beside crushing poverty through a form of collective monopoly power exercised by a small landowning, industrial and financial elite. The governing and wealthy classes created a form of ‘extractive capitalism’ aimed at securing a disproportionate share of the economic gains from industrialism, often by steering economic resources into unproductive use, with no or limited addition to economic value. ‘The efforts of men are utilized in two different ways’ declared the influential Italian economist Vilfredo Pareto in 1896. ‘They are directed to the production or transformation of economic goods, or else to the appropriation of goods produced by others’.
The long high poverty/inequality cycle and the strength of extraction are inter-connected. The cycle has only been broken once, when from 1945 the bitter ideological battle of ideas was finally won by pro-equality thinkers. The achievement of peak economic equality and an historic low for poverty in the 1970s was a seminal moment in British history. Yet it was short-lived, with the ideological baton passing to a group of New Right evangelists who proclaimed, falsely as it turned out, that a stiff dose of inequality would drive economic progress. As Sir Keith Joseph, a key adviser to Margaret Thatcher, put it in 1976: ‘the pursuit of income equality will turn this country into a totalitarian slum.’ From that point, egalitarianism was replaced by an entrenched bias to inequality. But instead of creating the promised economic and entrepreneurial renaissance, the new licence to get super rich simply triggered a second era of extraction and of Pareto’s ‘appropriation’ and a second wave of high poverty and inequality that is still in place.
Few other nations have applied a pro-inequality economic strategy as comprehensively as Britain and the United States. With the world’s top one per cent emitting twice the carbon emissions of the poorest half, the return of extraction also lies at the heart of the global climate crisis. Corporate leaders have exploited their growing muscle using business practices that have played havoc with pay, jobs, and livelihoods. As the American megabank Citigroup wrote in a confidential note to its clients a few years ago, the United States has long been aplutonomy, one that allows ‘the economic disenfranchisement of the masses for the benefit of the few’.
Examples of complex and carefully hidden extractive devices have included the application of monopoly power through the ruthless destruction of rivals and the rigging of financial markets, to the ‘skimming’ of trading profits – a process City traders like to call ‘the croupier’s take’ – and the engineering of company accounts. The boom in the private takeover of public companies since the millennium, from the AA to Boots and Morrisons, has enriched a generation of private equity barons, often at the expense of the survival of the targeted companies themselves. The long list of companies destroyed by such financial manipulation include ICI, GEC, BHS and Debenhams. Under extraction, economic activity becomes detached from new wealth creation, with the boost to profitability and rising corporate surpluses of recent times used to reward executives and investors rather than boost productivity. In 2019, global stock markets paid out record dividends of $1.37 trillion.
What has been at work is a form of levelling up at the top by levelling down at the bottom. While egalitarians have yet to regain the ideological high ground, one of the big questions of political economy of the next few years must be the extent to which an entrenched anti- egalitarian model of capitalism can be reformed?
__________________
Note: the above draws on the author’s new book, The Richer, the Poorer, How Britain Enriched the Few and Failed the Poor, a 200-year history ( Bristol University Press, 2021).
Stewart Lansley is a visiting fellow at the University of Bristol, a Council member of the Progressive Economy Forum and the author of Breadline Britain, The Rise of Mass Poverty (with Joanna Mack, 2015) and The Cost of Inequality (2011).