The gendered dynamics of ‘partygate’: leadership and hypermasculinity at the centre of Johnson’s administration


Posted: 30 May 2022 12:00 AM PDT

Anna Sandersand Dave Richards discuss the relationship between the number of fixed penalty notices issued to women in response to ‘partygate’ and the broader culture of hypermasculinity within the current government.

‘Against the backdrop of the pandemic, when the Government was asking citizens to accept far-reaching restrictions on their lives, some of the behaviour surrounding these gatherings is difficult to justify’. So began the findings of the long-awaited Sue Gray report, published on 25 May. These gatherings referred to a series of COVID-19 lockdown breaches within Number 10 – known as ‘Partygate’ – between 2020 and 2021. As a result of these breaches, the Metropolitan Police issued 126 Fixed Penalty Notices to civil servants working in Downing Street. Of the 126 fines, 53 were issued to 35 men, and 73 to 48 women. A recent Timesarticle highlights that ‘the fines fell disproportionately on junior women working within 10 Downing Street and that more senior male staff had not been fined’. Here, we consider why there was such a skewing effect in the number of fixed penalty notices [FPNs] issued to women.

Gender and senior leadership positions

One possible explanation for the gender disparity in FPNs is that within Whitehall, there has been an absence of women at the top echelons of political power. Access to leadership positions has historically played to the advantage of white, middle-class men. Analysis shows that by 2015, women comprised just 38.7% of those working in the top four pay bands of the civil service, despite making up over half (53.5%) of all UK civil servants. This overrepresentation of men in senior leadership positions is partly based on the culture of Whitehall itself. A 2015 report by the National Audit Office identified a ‘macho’, ‘competitive’ culture within top-level Whitehall positions, resulting in women choosing to ‘opt out of more senior roles in the civil service’.

While the absence of women in top leadership positions is a compelling explanation, the number of women appointed to senior positions has markedly increased over the last 24 months. As of 2021, women make up 47% of those in senior grade roles and they currently comprise six of 16 appointments at the most senior grade of permanent secretary in Whitehall.

A more nuanced analysis of gender and leadership positions is needed. Research highlights that political power is largely concentrated within the core executive, where women have traditionally been marginalised. A closer examination of civil service roles shows that women are absent from senior positions at the centre of government, such as Number 10, the Treasury, and the Cabinet Office. The six departments currently headed by women permanent secretaries are BEIS, the MoJ, DfT, DfE, Defra and DCMS.

The vast majority of fines were issued to those working in Number 10 and, relatedly, the Cabinet Office. Yet the FPNs issued by the Metropolitan Police are revealing, as they were also less likely to be issued to those working in more senior positions in these central offices, and therefore less likely to go to men. It suggests that the issue relates in part to women’s absence from the centre, rather than the top echelons of Whitehall. Notably, while some junior civil servants who attended Boris Johnson’s birthday celebrations were issued FPNs, Cabinet Secretary Simon Case – also in attendance – did not receive a fine. Others flagged in Gray’s report as being present at various events were Case’s predecessor Mark Sedwill and Johnson’s then Principal Private Secretary, Martin Reynolds. Like Case, neither Sedwill nor Reynolds received fines. One outlier was the former head of ethics and Deputy Cabinet Secretary, Helen MacNamara, who received an FPN for attending a leaving event in June 2020. In acknowledging the presence of senior leaders at the events, Gray notes that ‘the senior leadership at the centre, both political and official, must bear responsibility for this culture’.

Hypermasculine leadership

A more compelling explanation, then, is that of a hypermasculine leadership style of Prime Minister Boris Johnson and those senior male figures in Whitehall close to him. Hypermasculinity can manifest in the behaviour and rhetoric of leaders. Georgina Waylen definesJohnson’s hypermasculine leadership as ‘an English white ruling class one’, also evident in his ‘libertarian reluctance to circumscribe individuals’ behaviour’. This is perhaps best illustrated in the Gray report by Johnson’s attendance at a number of social gatherings, but also his tacit willingness to regularly allow gatherings in Number 10 to continue. A press conference delivered after the publication of the Gray report also saw a reluctance from Johnson to comment on specific individuals named in the report. There is a clear failure by both Johnson and Case to either call a halt or seek to discipline those in attendance. Johnson for now remains in office as the threshold for letters to the 1922 Committee remains unmet. For the Cabinet Secretary, Simon Case, there are growing calls for him to resign, including by the former Head of the Civil Service Lord Kerslake.

For Johnson’s government, this hypermasculinity has notably manifested in a culture of risk-taking. Outlined in the Gray report was an email from Reynolds to a special adviser, noting a drinking event in the Number 10 garden ‘which we seem to have got away with‘. Some have also noted a culture of heavy drinking at the centre of government as being emblematic of a culture of hypermasculinity in Johnson’s Number 10, reflecting his membership of the all-male, Oxford University Bullingdon Club. Though it should be noted that there are claims and counter-claims that Johnson himself is not a regular imbiber.

Similar examples of hypermasculinity can be seen in other areas of the government’s handling of the pandemic. This included delays in implementing COVID restrictions and a militaristic rhetoric of a ‘War against Covid’. The face of communication around the pandemic has also been a largely male one: researchshows that between March and May 2020, only 7% of COVID-19 briefings were led by a female politician.

The disproportionate effects of partygate on women, then, appear to be an issue both of male overrepresentation at the centre, alongside an embedded hypermasculinity in the Johnson government. While hypermasculinity is by no means exclusive to Johnson’s government, it has been rife. What this suggests is that a cultural shift is needed within Whitehall to address the gendered power dynamics that manifest within it.

____________________

About the Authors

Anna Sanders is a Research Associate at the ESRC’s Productivity Institute for the project The UK Productivity-Governance Puzzle: Are UK’s Governing Institutions Fit for Purpose in the 21st Century? and based in the Department of Politics, University of Manchester.

Dave Richards is Professor of Public Policy at the University of Manchester and affiliated to the ESRC’s Productivity Institute as P.I. on the project The UK Productivity-Governance Puzzle: Are UK’s Governing Institutions Fit for Purpose in the 21st Century?. He is also P.I. on the Nuffield Foundation funded projectPublic Expenditure Planning and Control in Complex Times: Whitehall Departments’ Relationship to the Treasury.
https://blogs.lse.ac.uk/politicsandpolicy/gendered-dynamics-partygate/?utm_source=feedburner&utm_medium=email

Extractive capitalism: Britain has been a high-inequality, high-poverty nation for most of the last 200 years, with significant consequences for life chances, social resilience, and economic strength

Stewart Lansley writes that Britain’s model of ‘extractive capitalism’ – with a small elite securing an excessive slice of the economic cake – has created a two-century-long high-inequality, high-poverty cycle, one broken for only a brief period after the Second World War.

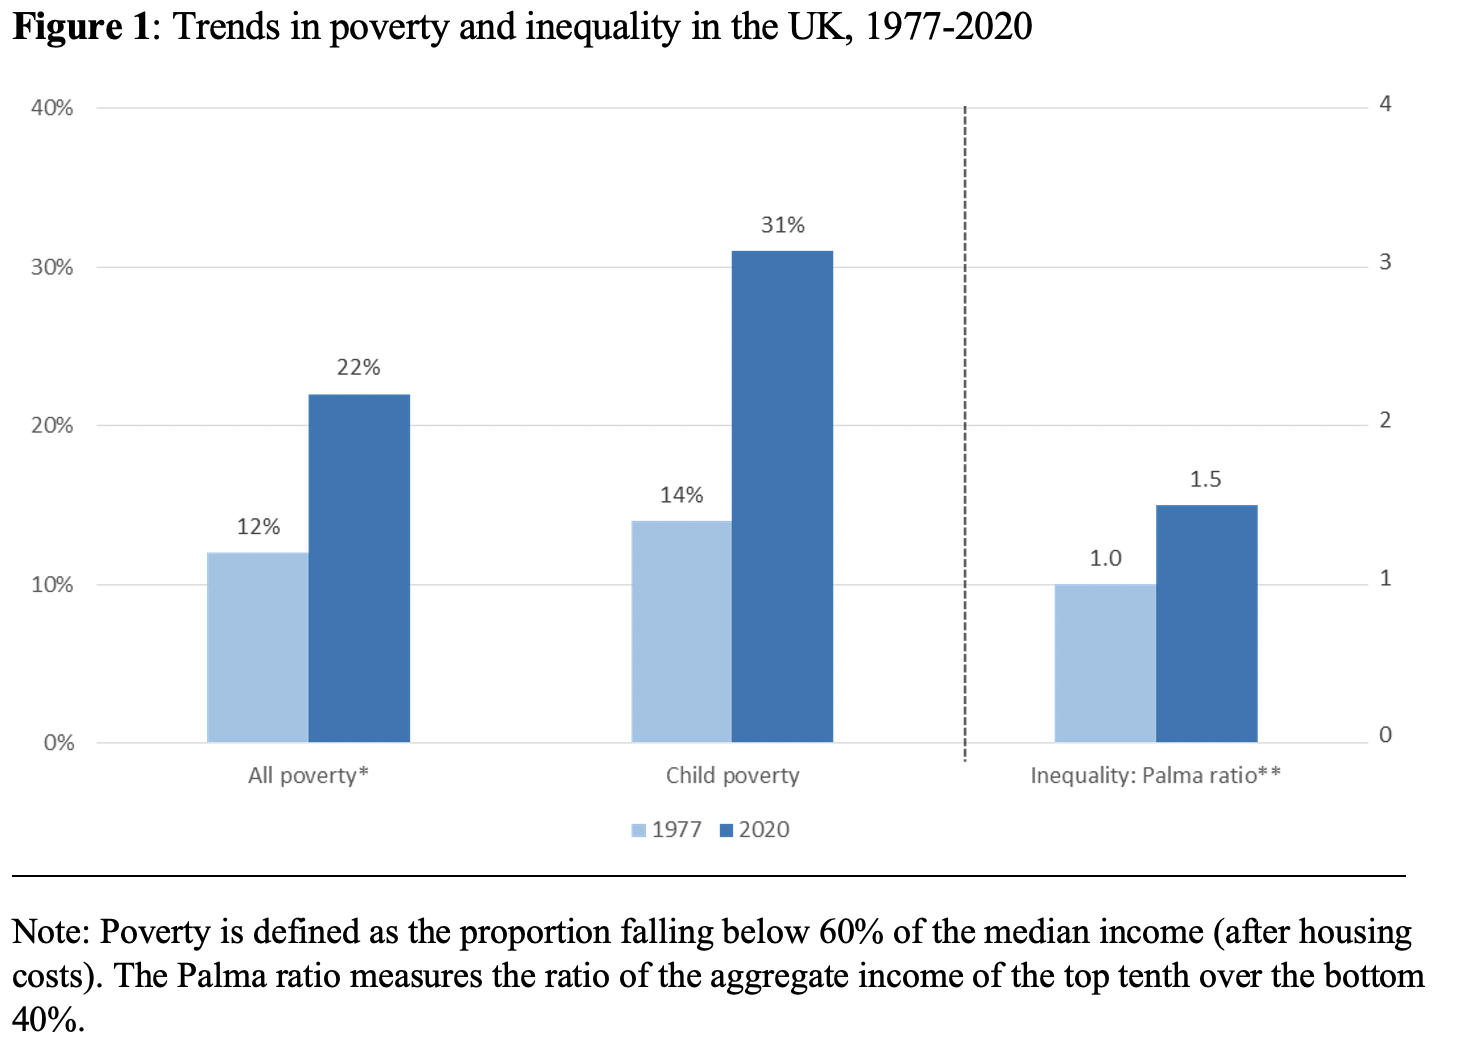
Over the last four decades, Britain has moved from being one of the most equal of rich nations to the second most unequal (after the United States). The same period has also seen a surge in levels of poverty, with the child poverty rate more than double that of the late 1970s (figure 1).

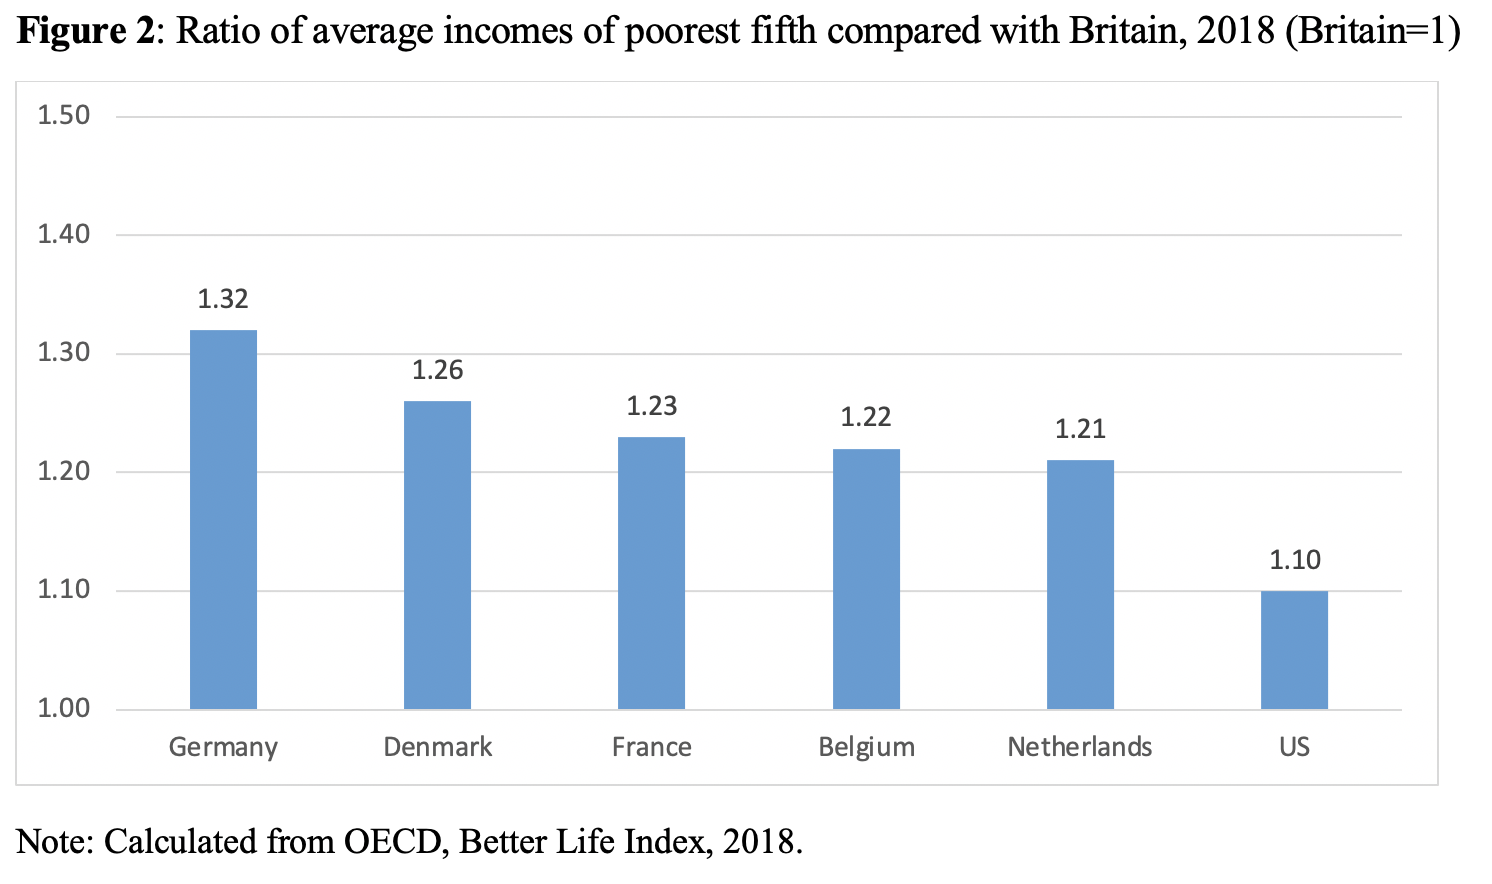
That these two key measures of social fragility have moved in line is no surprise. History cannot be clearer: poverty and inequality are critically linked. Poverty occurs when sections of society have insufficient resources to be able to afford a minimal acceptable contemporary living standard. Its scale is ultimately determined by how the ‘cake is cut’. Barring the short post-war period, Britain has been a high-inequality, high-poverty nation for most of the last 200 years, with significant consequences for life chances, social resilience, and economic strength. Because of the impact of inequality, the poorest fifth of Britons are today much poorer that their counterparts in other, more equal nations (chart 2). Germany’s poorest, for example, are a third better off than those in Britain.

Poverty and inequality levels are ultimately rooted in the outcome of the political and economic power games that play out between big business, state, and society. With the exception of the immediate post-war era, the struggles for share over the last 200 years have been won by the richest and most affluent sections of society, often with the compliance of the state.

For most of the nineteenth century, Britain was a near-plutocracy, with society run mostly by and for the richest sections of society. Colossal and heavily concentrated wealth sat beside crushing poverty through a form of collective monopoly power exercised by a small landowning, industrial and financial elite. The governing and wealthy classes created a form of ‘extractive capitalism’ aimed at securing a disproportionate share of the economic gains from industrialism, often by steering economic resources into unproductive use, with no or limited addition to economic value. ‘The efforts of men are utilized in two different ways’ declared the influential Italian economist Vilfredo Pareto in 1896. ‘They are directed to the production or transformation of economic goods, or else to the appropriation of goods produced by others’.

The long high poverty/inequality cycle and the strength of extraction are inter-connected. The cycle has only been broken once, when from 1945 the bitter ideological battle of ideas was finally won by pro-equality thinkers. The achievement of peak economic equality and an historic low for poverty in the 1970s was a seminal moment in British history. Yet it was short-lived, with the ideological baton passing to a group of New Right evangelists who proclaimed, falsely as it turned out, that a stiff dose of inequality would drive economic progress. As Sir Keith Joseph, a key adviser to Margaret Thatcher, put it in 1976: ‘the pursuit of income equality will turn this country into a totalitarian slum.’ From that point, egalitarianism was replaced by an entrenched bias to inequality. But instead of creating the promised economic and entrepreneurial renaissance, the new licence to get super rich simply triggered a second era of extraction and of Pareto’s ‘appropriation’ and a second wave of high poverty and inequality that is still in place.

Few other nations have applied a pro-inequality economic strategy as comprehensively as Britain and the United States. With the world’s top one per cent emitting twice the carbon emissions of the poorest half, the return of extraction also lies at the heart of the global climate crisis. Corporate leaders have exploited their growing muscle using business practices that have played havoc with pay, jobs, and livelihoods. As the American megabank Citigroup wrote in a confidential note to its clients a few years ago, the United States has long been aplutonomy, one that allows ‘the economic disenfranchisement of the masses for the benefit of the few’.

Examples of complex and carefully hidden extractive devices have included the application of monopoly power through the ruthless destruction of rivals and the rigging of financial markets, to the ‘skimming’ of trading profits – a process City traders like to call ‘the croupier’s take’ – and the engineering of company accounts. The boom in the private takeover of public companies since the millennium, from the AA to Boots and Morrisons, has enriched a generation of private equity barons, often at the expense of the survival of the targeted companies themselves. The long list of companies destroyed by such financial manipulation include ICI, GEC, BHS and Debenhams. Under extraction, economic activity becomes detached from new wealth creation, with the boost to profitability and rising corporate surpluses of recent times used to reward executives and investors rather than boost productivity. In 2019, global stock markets paid out record dividends of $1.37 trillion.

What has been at work is a form of levelling up at the top by levelling down at the bottom.  While egalitarians have yet to regain the ideological high ground, one of the big questions of political economy of the next few years must be the extent to which an entrenched anti- egalitarian model of capitalism can be reformed?

__________________

Note: the above draws on the author’s new book, The Richer, the Poorer, How Britain Enriched the Few and Failed the Poor, a 200-year history ( Bristol University Press, 2021).

About the Author

Stewart Lansley is a visiting fellow at the University of Bristol, a Council member of the Progressive Economy Forum and the author of Breadline Britain, The Rise of Mass Poverty (with Joanna Mack, 2015) and The Cost of Inequality (2011).

LSE Blogs

‘Levelling-up’: the government’s plans aren’t enough to promote economic growth and tackle inequality

The government’s levelling-up plan dodges the hard choices says Henry Overman. Countering the economic forces behind the UK’s spatial disparities requires addressing multiple barriers and allowing differing approaches – and the funds committed so far don’t appear to be proportionate to the scale of the challenge.

The government’s Levelling-Up White Paper focuses on 12 missions that aim to level-up the UK. Lots will be said about whether the government is spending enough (almost certainly not), whether devolving more powers is a good thing (almost certainly), and how much of their plan is different to past efforts (not much, for those of us that remember the 1990s and 2000s).

Setting these issues aside, does the economic strategy make sense? If government spent enough, and gave places the right powers, would pay, employment and productivity gaps narrow? The answer will depend on how government resolves the fundamental tension between the role of ‘globally competitive cities’ (part of mission 1) and other local economies spread across the country. For the economic strategy to work, the evidence suggests that spatially concentrated investment is crucial, but politics and a concern for quality of life make the case for equalising spending.

Many things determine spatial disparities in Britain. The legacy of 1970s deindustrialisation, the ongoing shift from manufacturing to services, and falling communication and transportation costs all play a part in changing the geography of jobs and the demand for different types of workers. Spatial differences in educational attainment, the selective migration of skilled workers and differences in amenities and costs of living help determine the supply of different types of workers. Demand for and supply of skills interact in a way that can be self-reinforcing, meaning large spatial differences can emerge and persist. Levelling-up policy must counter these economic forces if it is to succeed.

One important consequence of these economic forces is that spatial disparities in earnings – which the government wants to narrow – largely reflect the concentration of high-skilled workers. The share of adults with degrees ranges from 15 per cent in Doncaster to 54 per cent in Brighton. High-skilled workers tend to work in better performing labour markets, which further magnifies individual labour market advantages. At least 60 per cent and up to 90 per cent of differences in average wages across areas can be attributed to differences in the types of people who work in different places.

This has important consequences for ‘levelling up’. A pragmatic aim for the economic strategy might be to improve economic performance in some areas outside of London and the South-East – reducing spatial disparities at the regional level, if not necessarily across more narrowly defined local areas. This would allow talented young people in left-behind places to access better paid opportunities without having to move across the country.

To generate these opportunities and counter the self-reinforcing feedback loops – which mean the highest paid jobs are concentrated in London and a handful of other areas – large investments will be needed in a limited number of cities to attract high-skilled workers and the firms that employ them. The mention of globally competitive cities (as part of mission 1) suggests that the government understands this key point.

Why focus on the high-skilled? Because the evidence – much of which is discussed in a report on spatial inequalities by myself and Xiaowei Xu, written for the IFS Deaton Review – suggests that the impact of targeted R&D investment(mission 2), infrastructure (missions 3 and 4), public sector relocation and other place-based policies will be small unless they significantly alter the composition of the workforce in an area. Even a project of the size of HS2, for example, will do little for the economy of the West Midlands unless it somehow improves local educational outcomes for children growing up there or encourages a much larger share of graduates and the firms that employ them to locate there.

And why cities, not towns? Such investments could improve earnings in any area. However, there are many small towns, investment in infrastructure and innovation is costly, and there are only so many public sector jobs to relocate. Focusing on towns, especially with limited funds, does not scale up to produce large effects across lots of areas.

Looking to cities recognises that the advantages of high-skilled areas are self-reinforcing. The concentration of high-skilled firms and workers generates productivity advantages for firms and better labour market outcomes for workers. In turn, this attracts high-skilled workers from across the country. In short, London’s economic advantages stem from the concentration of skilled firms and workers, and from its economic size, and these factors are self-reinforcing. London’s economic strength also spills over to benefit towns and cities across the wider South-East.

To provide a counterbalance to London and the South-East, investment needs to kick-start these self-reinforcing processes elsewhere. The fact that size is one key part of this self-reinforcing cycle explains why that investment needs focusing on cities.

Unfortunately, we need to recognise that these policies are likely to benefit high-skilled workers more than low-skilled workers. For talented children growing up in struggling towns, increased opportunities nearby offer the option of commuting or a small-distance move, making it easier to maintain links with family and friends. Moreover, some of these benefits will trickle down to the lower-paid in the form of moderately higher wages and improved employment rates, but at the cost of expensive housing.

Sadly, while all these trickle-down benefits are possible, London – with its many poor neighbourhoods, expensive housing and high poverty rates – points to the limits of this approach for improving outcomes for those at the bottom of the income distribution. A more equal spread of graduates – and globally competitive cities in each region – may help reduce spatial disparities and may even help improve the overall performance of the economy, but it is no simple fix for improving outcomes for poorer households. To do this, complementary investments must make sure that households can access the opportunities generated.

The current debate often interprets this as being about ‘better transport’. For many poorer households, however, transport investment generally will not be enough. Again, examples from London illustrate the issues – Barking and Dagenham (areas in the east of London) have good transport links to one of the largest concentrations of employment in the world, but this is not enough to prevent low earnings for many households who live there. If poorer households are to benefit from the kind of investments described above, then they will need help to improve their education and skills.

For some households, the multiple barriers that prevent individuals from being able to access better economic opportunities go beyond education and skills. Many of the ‘left-behind’ places that levelling-up wants to target have high proportions of vulnerable people with complex needs and low levels of economic activity. This compounds their problems, as long-term unemployment, poverty, mental illness and poor health often go hand-in-hand.

Addressing these multiple barriers will involve significant investment not only in education and skills, but also in childcare, and in mental and physical health services. Research suggests that small tinkering and minor tweaks of existing policies will not be enough to tackle the multiple barriers faced in these places. The White Paper recognises these issues with its focus on education (missions 5 and 6) and health (mission 7), but the funds committed so far do not appear to be proportionate to the scale of the challenge.

I have focused on the economics of levelling up but it is important to be clear that spending on levelling-up does not always need to be justified based on economic growth. There are important public good arguments that can justify increased expenditure across a wide range of policy areas. And unlike the economic strategy, there is a strong case that these funds should be equally distributed. For example, it is possible to argue for subsidising rural broadband (part of mission 4) as a public good, while recognising that its economic impacts are likely to be limited. In addition, although such policies, including those around wellbeing (mission 8), pride in place (mission 9) and crime (mission 11) do not specifically target the bottom of the income distribution, they will often benefit poorer households most.

Places matter to people. For many people, the place where they grow up will become the place where they live and work. Disparities in economic opportunities, in costs of living and in amenities provide the context for, and directly influence, the decisions they take and the life they will live.

Improving economic performance and helping to tackle the problems of left-behind places are both important policy objectives. Addressing these challenges requires a new approach to policy, one that allows for different responses in different places. Such variation makes many people nervous. Constituency based politics mean that political messages tend to prefer spending everywhere. However, policy must allow for this variation. Devolved power (mission 12) will help but central government will still need to grapple with the fundamental trade-off between concentrating spending to help achieve the economic strategy while spreading out spending to meet the other objectives.

I would argue that this becomes easier if we remember that we should care more about the effect of policies on people than on places. If this is the case, we should judge the success of levelling-up on the extent to which it improves individual opportunities and on who benefits, rather than on whether it simply narrows the gap between places.


___________________

About the Author

Henry Overman is Professor of Economic Geography in the Department of Geography and Environment at the London School of Economics and Director of the What Works Centre for Local Economic Growth. He is Research Director of the Centre for Economic Performance.

https://blogs.lse.ac.uk/politicsandpolicy/levelling-up-the-governments-plans-arent-enough-to-promote-economic-growth-and-tackle-inequality/?utm_source=feedburner&utm_medium=email

Official statistics underestimate wealth inequality in Britain

The latest statistics from the ONS are a welcome but limited insight into what has been happening to wealth in Britain, write Arun Advani andHannah Tarrant. Limitations in survey response mean they will underestimate the share of wealth at the top. But while they will not tell us what has happened as a result of the pandemic, we can use them to provide an educated guess.

The ONS’s latest figures on what has been happening to wealth in Great Britain, released in January 2022, are already out of date, covering only the period up to March 2020, and therefore missing the effects of the pandemic. But they are also limited in another way: they underestimate the share of wealth going to the richest households. Given the debates about inequality, discussion about wealth taxes to pay for COVID-19, and the growing importance of inherited wealth as a share of lifetime resources, it is important to get this right.

Total wealth is underestimated

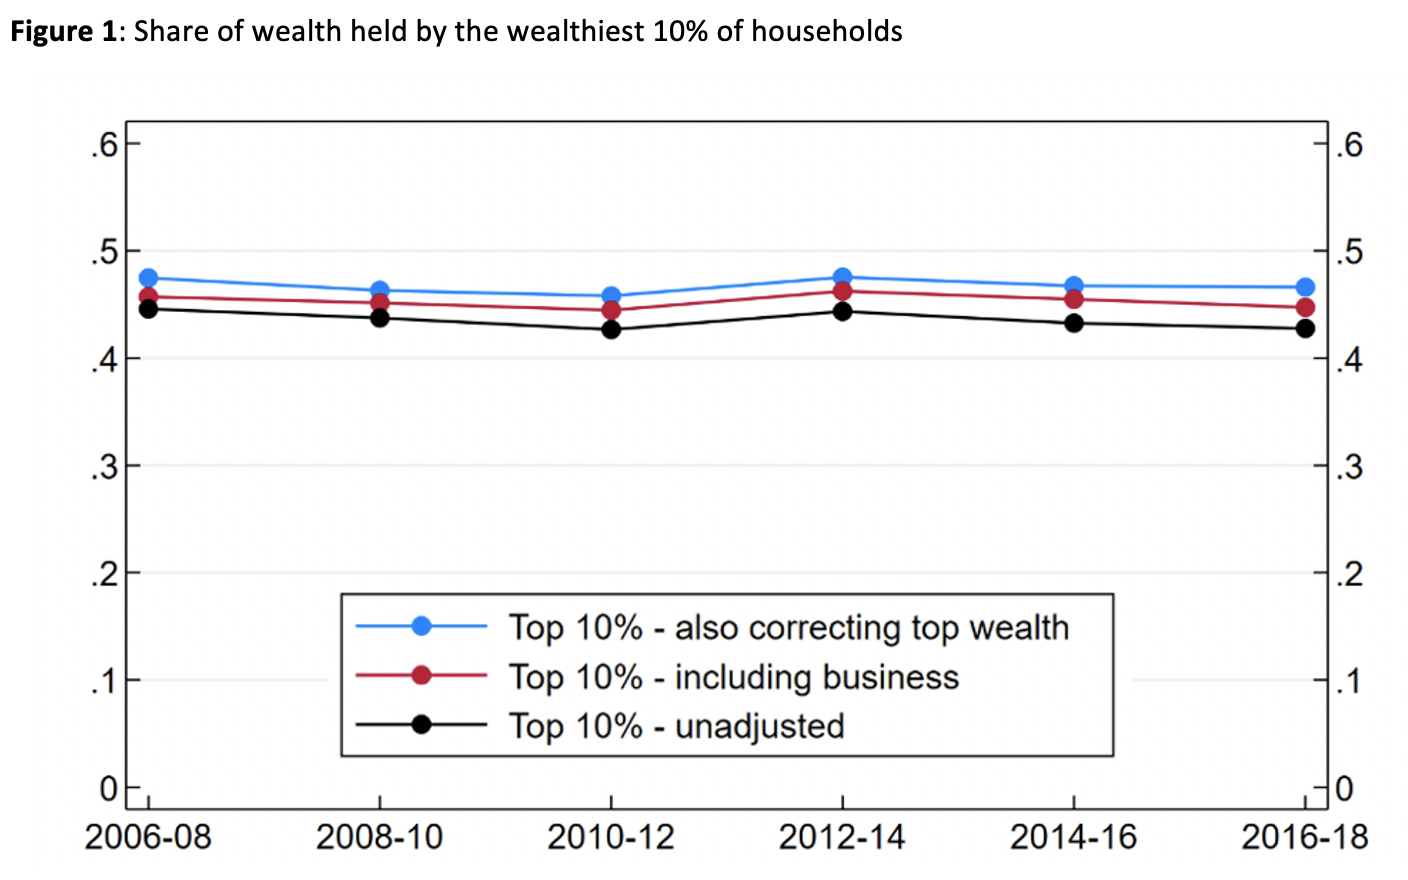
Looking back at the past 12 years of the ONS survey, the figures show that total wealth in Great Britain has risen from £10.4tn to £14.6tn (in 2016–18 prices), meaning average household wealth has risen from £402,100 to £564,300. Over the same period, the share of all wealth held by the wealthiest 10% of households has risen very slightly, from 44% to 45%. However, there are two problems with these figures. First, they do not include business wealth, which is an important source of wealth for the wealthiest households. Second, they substantially under-record the total wealth held by wealthy households, since, unsurprisingly, the very wealthy do not tend to respond to such surveys.

Adjusting the data to account for business wealth – which is measured in the survey but excluded from official statistics – we find that total wealth in Great Britain is £0.7tn higher in 2016–18. This is about 5% of the current estimate, and the proportional underestimation has been similar back to 2010–12. After adding in wealth observed in the Sunday Times Rich List, and using a statistical approach to correct for the under-representation of other wealthy households, total wealth is higher still, by £0.5tn in 2016–18. Total GB wealth is therefore underestimated in the ONS figures by about 8%.

Top wealth is higher than officially reported

After making these adjustments, the level of inequality is also higher (Figure 1). Adding business wealth into the calculation, the share of wealth owned by the wealthiest 10% of households actually rises significantly, by two percentage points. Consistent with the ONS figures, this has remained broadly steady over the period. Correcting for missing wealth at the top, we find the share of wealth going to the top 10% is further increased slightly, to around 47%, and still flat.

Notes: Constructed using data from the Wealth and Assets Survey (WAS) and the Sunday Times Rich List (STRL). ‘Including business’ adds business wealth to the ONS measure of wealth used in official statistics. ‘Also correcting top wealth’ additionally includes the wealth from the STRL and a ‘Pareto correction’ for under-reported wealth among the wealthiest households. See Advani Bangham and Leslie (2021) and Advani Hughson and Tarrant (2021)for details of the correction method. Top shares are measured at household level, consistent with the ONS.

Political movements after the financial crisis, and the work of economists like Thomas Piketty, have favoured looking at wealth concentration among smaller groups – specifically the top 1% wealthiest households. The ONS does not provide figures for this group. Constructing this measure ourselves, we see the importance both of including business wealth and of correcting for under-coverage at the top. Together, these adjustments add around 55% (6 percentage points) to the share of wealth owned by the top 1% in 2016–18 (Figure 2).

Notes: same as for Figure 1.

Other inequalities in wealth

There are also important demographic differences in wealth holdings that are worth highlighting. Men typically have higher levels of wealth: they hold almost 40% more wealth than women, on average. Wealth is concentrated among older individuals. This is partly because individuals close to retirement have had their whole working life to save, but they also benefited ‘from both benign economic developments (such as rapid rises in the value of their homes, generous occupational pension provision and decades of healthy wage growth) and generous government policies (such as free university tuition, big tax breaks for pension saving and capital gains on main homes, and the ‘triple lock’ on the state pension)’.

Wealth differences between households from different ethnic groups are stark: households whose ‘Household Reference Person’ (HRP, the main respondent to the survey) is of white ethnicity are four times more likely to have wealth in excess of £500,000 than households with a black African HRP. There are important differences in household wealth portfolios too: Pakistani and Indian households are less likely to hold pension wealth, with home ownership being more important in their asset holdings.

Previous analysis by the ONShighlights significant regional variation in household wealth. Median wealth is more than 2.5 times higher in the South East compared to the North East. This variation can largely be explained by differences in house prices, with changing house prices contributing to a growing divergence in wealth levels across regions.

Wealth trends since the pandemic

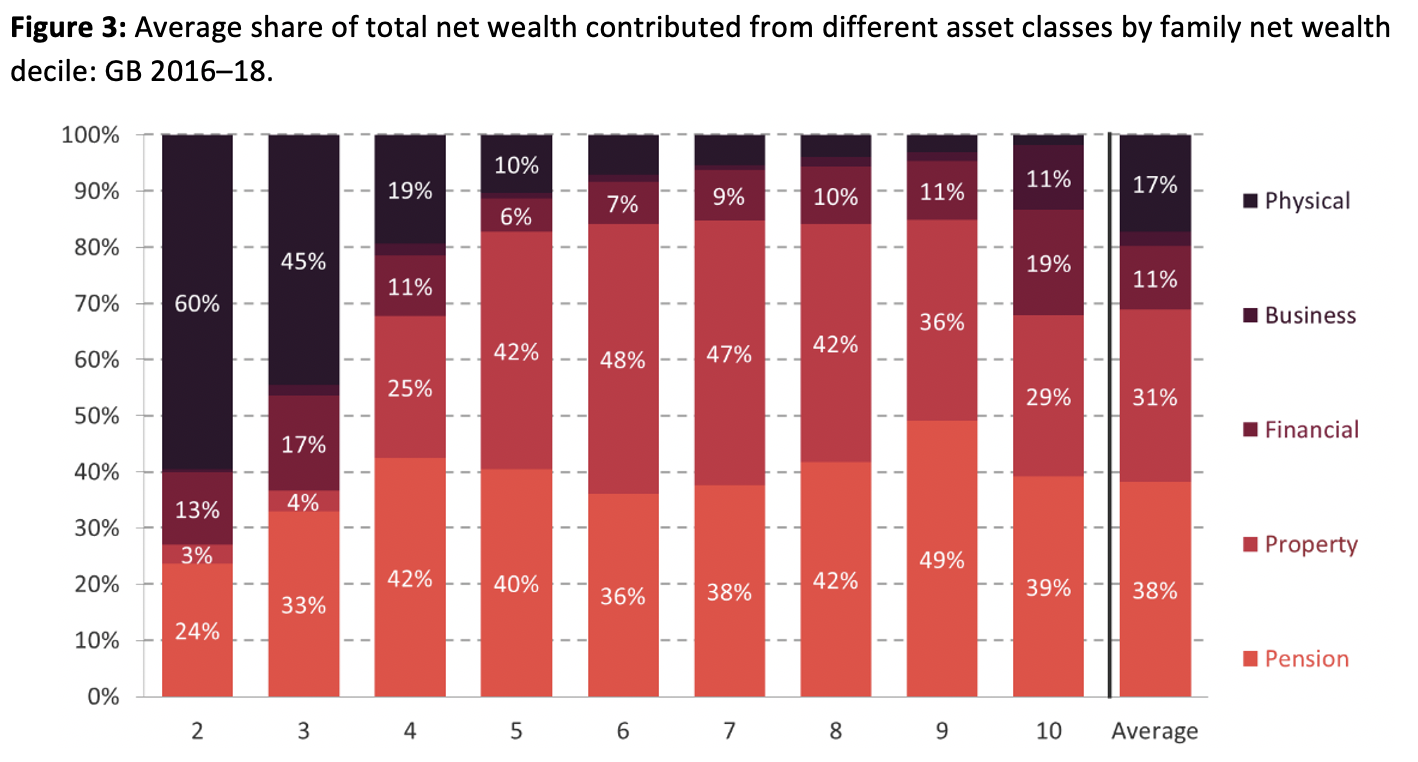
Although these latest figures will not provide direct information on what has happened to wealth since the start of the pandemic, a look at the historic survey data does provide some insight. Dividing the population up into deciles, there are clear differences in asset holdings across the distribution. We know that the average house price rose by 16% between the start of the pandemic and October 2021, and these gains were middle-weighted (Figure 3). Falling interest rates also increase the value of pensions, which are similarly middle-weighted. Meanwhile, stock market growth of around a third since the pandemic lows has disproportionately benefited richer households, though the impact of the pandemic on private businesses is less easy to measure. COVID-19 has also led to those at the bottom of the distribution, who experienced the biggest hit to their savings, falling further behind the rest.

Notes: The lowest decile is excluded as net wealth is negative. Source: Advani, Bangham and Leslie (2021).

What does this mean for the effects of the pandemic on wealth inequality? Overall, the wealthiest have clearly gained most in cash terms over the pandemic. But apart from among the super-wealthy – where there has been very rapid wealth growth – the effect on wealth concentration is likely to be less visible because there are large gains relative to initial wealth for those in the middle as well as those at the top.

____________________

About the Authors

Arun Advani is Assistant Professor in the Department of Economics at the University of Warwick.

Hannah Tarrant is Research Officer in the International Inequalities Institute at LSE.

https://blogs.lse.ac.uk/politicsandpolicy/official-statistics-underestimate-wealth-inequality/?utm_source=feedburner&utm_medium=email

The teenager’s poem that reveals the cruel reality of life in modern Britain

https://poems.poetrysociety.org.uk/poems/welcome-to-tottenham/

Aditya Chakrabortty
To policymakers, poet Giovanni Rose would be just a statistic. But like everyone ignored by politicians, he is so much more

What if a statistic could speak its own truth? What if a stereotype could confound your expectations?

A few weeks back, I was riffling through the local papers when a story jumped out. A schoolboy in Tottenham, north London, had just won an award as a Foyle Young Poet of the Year. At the bottom was printed his poem. Called Welcome to Tottenham, it brought the news from a society that is only a few miles from Westminster but might as well be a whole world away.

When historians such as EP Thompson and Eric Hobsbawm took ordinary people’s lives and perspectives as their subjects, rather than stories of kings and generals, their work was labelled history from below. So let’s call this poem news from below, the headlines as if Liz Truss didn’t matter (imagine) and blue-on-blue combat was a soap playing on a far-off screen. The news, in other words, for the country in which most of us actually live.

Welcome to Tottenham.

Where we wake up to the smell of ‘Chick king’,

Mixed with the odour of the corpse from the night before.

Where we cover our blood stained streets with dried up gum,

Where kids have holes in their last pairs of shoes,

Where daddy left mummy and mummy’s left poor.

Youtube

Giovanni Rose: Welcome to Tottenham.

Giovanni Rose wrote his poem in a few hours on a Covid-era Chromebook handed out by his school. The teenager didn’t need to make stuff up; he jotted down the world he’d been born into. In person, he’s neither swot nor class clown, just a kid who keeps his head down and never swears in front of grownups and talks softly in the same rubbery twang as most working-class youngsters in London today. And with the same unblinking clarity that marks his verse, he knows how strangers see him.

A 17-year-old black boy, he has been stopped and searched by the police on his local high road and off Oxford Street, even once by armed officers when he was, irony of ironies, making a short film against knife crime. To policymakers, he’s a statistic; to ministers he’s a stereotype; and to the media, people like Giovanni are … what, exactly? Case studies, perhaps, to be allotted their 10-second clip on the evening news and then chucked away.

But a democracy that can’t or won’t listen to outsiders such as him is not only missing out: it’s falling down on the job. A political class that hand-waves about “the youth” would be best advised to shut up and listen to them. And the thing about Giovanni, and all the others who get talked over in our politics, is that they don’t fit their cutouts. They are so much bigger.

Giovanni knows wearing joggers and a hoodie gets him marked down as a thug – except they’re comfy, so he puts them on anyway. He grew up in one of the most deprived parts of England but he won’t let that define him either. His GCSEs were a string of 8s and 9s, and if his A-levels come in as predicted he should be off next September to study maths at a top university.

Let me admit also to a personal interest. To go from Giovanni’s childhood, in the shadow of the Northumberland Park estate, and mine, right by Edmonton Green, takes a mere 10 minutes by bus but nearly three decades of history. I grew up under Thatcher; he’s got Johnson. He is black; I am brown. Our paths cross and abut each other. His landscape is mine, almost, but as foreign as time renders everything. And so, after meeting and speaking a few times, he agreed to show me how my old world looks to a teenage boy today.

Where we ride around on stolen scooters,

Where we can’t afford tuition so the streets are our tutors.Advertisement

His childhood home is in a street with a church-cum-foodbank but backs on to a drug house: a small terrace cottage out of which industrial quantities of drugs were sold. Every time police raided, the dealers would jump the fence into his backyard. Too young to know what was going on, Giovanni would panic that burglars were breaking in.

“The last straw for my mum was when a dealer got Tasered by the police in my garden,” he recalls. “It’s kind of funny now. But at the same time, it’s not normal.”

His secondary school has to help hundreds of kids growing up in abnormal circumstances prepare for a world that expects them to behave perfectly normally. “They come in with trauma, having faced violence or sexual abuse,” says Jan Balon, head of the London Academy of Excellence Tottenham. He has recruited what is essentially a mental health unit, which counsels just under 10% of the student body throughout the week. It costs, Balon admits, “a stupid amount of money” but the NHS services are too underfunded and overwhelmed to rely on.

I love but I hate my home,

I still listen to the voicemails of my dead peers in my phone

One night when he was 14, Giovanni was woken by the sound of gunshots. Out of his bedroom window, he could see the aftermath of a drive-by. Seventeen-year-old Tanesha Melbourne-Blake had been killed in a hail of bullets. For years afterwards, the road was decorated with memorials to her.

He was only 15 when a close friend went with a younger mate to try to retrieve a stolen £90 pair of trainers. The friend never came home. A 21-year-old man stabbed him 10 times. Not long before, he’d left Giovanni a voice note on Snapchat. “Just random, like ‘How are you, bro?’” Giovanni used to listen to it afterwards. “Because I missed him.”

Giovanni came into a world where adults of all kinds could not be automatically trusted: not the local gangsters, nor the police. Nor others who purported to be in authority. He was born as the war in Iraq went from false triumph into naked disaster. He started at primary as the financial crisisturned into a global depression. The year after, austerity began. He was seven when Tottenham erupted over the police killing of Mark Duggan and his family home was a mile away from ground zero of the riots that would consume London and then England. And over the past couple of years, he’s been out of school for nearly six months, his wifi breaking amid remote lessons and pleading with his eight-year-old twin siblings not to disturb him during class. But with his own bedroom, he counts among his peers as lucky.

We fight over streets we don’t own

Knife crime’s on the rise because the beef can’t be left alone.

Giovanni’s mum drilled him well, both in studies and on the streets: stick to the main roads, keep looking over your shoulder. He never just goes for a walk without a destination, always knows who’ll be there and when he should be back (roughly: he’s a teenager, after all). He lives in what Yvonne Kelly, a professor of lifecourse epidemiology at UCL, calls “a state of hyper-vigilance”.

“Just constantly worrying who’s about to come up behind him means a high level of cortisol will be swilling around his system,” she says. “If that’s repeated day after day after day, it could make him physically ill.” And so psychological threat can turn into bodily damage.

In a couple of weeks, Giovanni will sit his mock exams, having already faced tests that most of us will never know. And then … well, then he wants to get out of Tottenham, leave all this behind. His hero is the rapper Stormzy, “a rich black man who got out of the hood”. That’s his dream, and now it’s within reach.

“A bit of me feels: ‘I made it out!’ I’m relieved I survived, but I miss this space. Most of my friends are here, most of my memories are here. Even the smell of the chicken shop.”

While he’s revising for his A-levels, ask yourself two questions: how Great can Britain be, if a boy counts himself lucky just to survive here? And what is the value of a childhood home if you’re constantly taught you must leave it behind?

  • Aditya Chakrabortty is a Guardian columnist and senior economics commentator
  • Excerpts from Welcome to Tottenham quoted by kind permission of Giovanni Rose

Guardian UK