

The UK national debt is the total amount of money the British government owes to the private sector and other purchasers of UK gilts.
Public sector net debt was £1,039.5 billion at the end of August 2012, equivalent to 66.1% of GDP
Source: Office National Statistics publications[1] (page updated Sept 28th, 2012)
If all financial sector intervention is included (e.g. Royal Bank of Scotland, Lloyds), the Net debt was £2311.6 billion (147.3 per cent of GDP. This is known as the unadjusted measure of public sector net debt.
Public sector net borrowing (PSNB – annual deficit) was £125.7 billion for 2011/12; £143.2 billion or 11.% of GDP.
The equivalent OBR forecast for 2011/12 is £122 billion.
Graph Showing UK National Debt
See Graph1 at end of article
After a period of financial restraint, National debt at a % of GDP fell to 29% of GDP by 2002. Then, national debt as a % of GDP increased from 30% in 2002 to 37 % in 2007. This was despite the long period of economic expansion; it was primarily due to the government’s decision to increase spending on health and education. There has also been a marked rise in social security spending.
Since 2008, National Debt has increased sharply because of:
Economics recession (lower tax receipts, higher spending on unemployment benefits) The recession particularly hit stamp duty (falling house prices) income tax and lower corporation tax.
These cyclical factors have exposed an underlying structural deficit
Financial bailout of Northern Rock, RBS, Lloyds and other banks.
Comparison With Other Countries
Although 62% of GDP is a lot, it is worth bearing in mind that other countries have a much bigger problem. Japan for example has a National debt of 194%, Italy is over 100%. The US national debt is close to 75% of GDP. [See other countries Debt]. Also the UK has had much higher national debt in the past, e.g. in the late 1940s, UK debt was over 180% of GDP. Nevertheless, there are reasons why the UK couldn’t borrow the same sums that we did post-war.
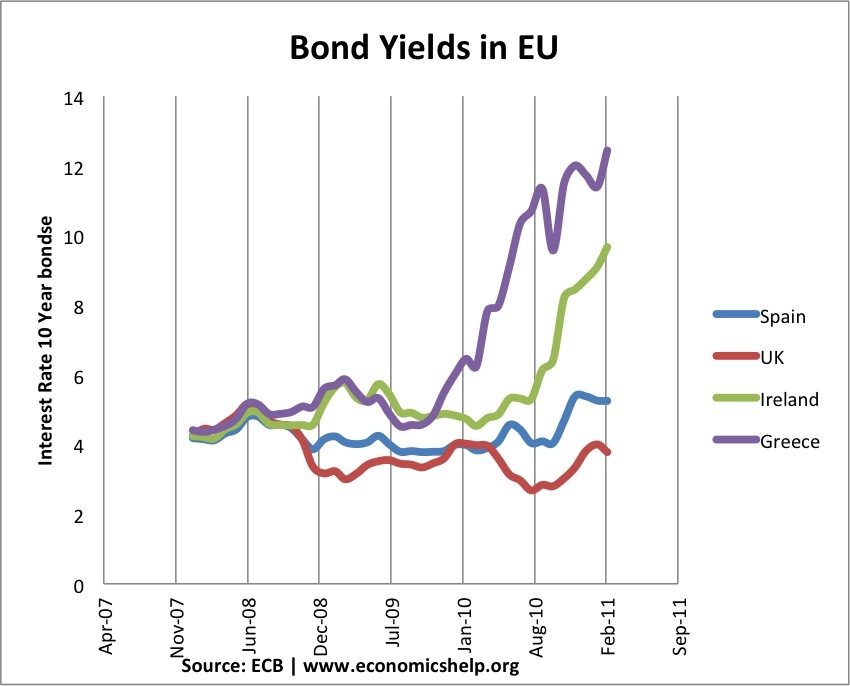
Debt and the Euro
See Graph2 at end of article
One good feature of the UK’s current debt position is that it hasn’t led to a rise in government bond yields. Countries in the Eurozone with similar debt levels have seen a sharp rise in bond yields putting greater pressure on government to cut spending quickly. However, being outside the Euro with an independent Central Bank (willing to act as lender of last resort to the government) means markets don’t fear a liquidity crisis in the UK; Euro members who don’t have a Central Bank willing to buy bonds during a liquidity crisis have been more at risk to rising bond yields and fears over government debt. See: Bond yields on European debt | (reasons for falling UK bond yields)
Cost of National Debt
The cost of National debt is the interest the government has to pay on the bonds and gilts it sells. In 2011, the debt interest payments on UK debt are anticipated to be £48.6 bn (3% of GDP). This is a sharp increased on two years ago. In 2011, the increased cost of interest payments outweighed a significant % of the governments spending cuts. (what does government spend money on)
Future of National Debt
It is estimated gross government national debt will could rise close to 100% of GDP by 2015. It is way above the government’s sustainable investment rule of 40% maximum.
However, the debt situation can be improved through:
Economic expansion which improves tax revenues and reduces spending on benefits like Job Seekers Allowance. However, the economic slowdown which has occurred since 2010 risks pushing the UK bank into a double dip recession and therefore further squeeze on tax revenues.
Improved performance of banks increases prospect of regaining financial sector intervention
Government Spending cuts and tax rises (e.g. VAT) which improve public finances. However, the big issue is the extent to which these spending cuts could reduce economic growth and therefore hamper attempts to improve tax revenues.
See: practical solutions to reducing debt without harming growth
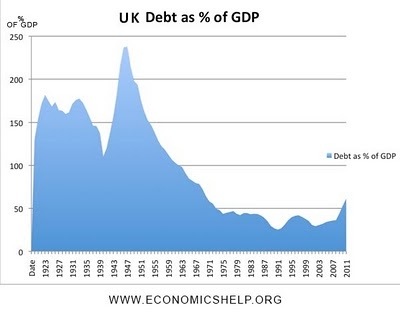
History of National Debt
UK National Debt since 1918
See Graph 3 at end of article
See also: Historical National debt
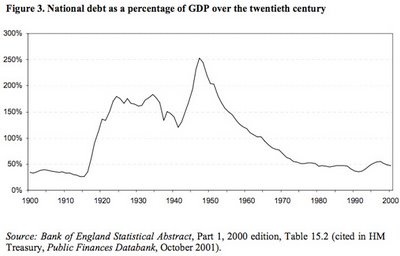
National Debt since 1922. Source: HM Treasury and UK Public Spending [1]
See Graph 4 at end of article
These graphs show that government debt as a % of GDP has been much higher in the past. Notably in the aftermath of the two world wars. This suggests that UK debt is manageable compared to the early 1950s. (note, even with a national debt of 200% of GDP in early 1950s, UK avoided default and even managed to set up the Welfare State and NHS. However, in the current climate, the UK wouldn’t be able to borrow the same as in the past. For example, private sector saving is lower, US wouldn’t give us big loan like in 1950s.See more at:
How much can a government borrow?
What are the prospects for UK debt default?
What is the Real Level of UK National Debt?
It is argued by some that the UK’s national debt is actually a lot higher. This is because national debt should include pension contributions and private finance initiatives PFI which the government are obliged to pay.
The Centre for Policy Studies (at end of 2008) argues that the real national debt is actually £1,340 billion, which is 103.5 per cent of GDP. This figure includes all the public sector pension liabilities such as pensions, and private finance initiative contracts e.t.c (and Northern Rock liabilities).
However, these pension liabilities are not things the government are actually spending now. Therefore, there is no need to borrow for them yet. It is more of a guide to future public sector debt. I don’t accept the fact that future pension liabilities should be counted as public sector debt. In 2006, the Statistics Office did change calculations to include some PFI into public sector debt figures [pdf – Treasury.gov.uk]
However, it is a sign that it will be difficult to improve finances in the future.
Another problem is that with the financial crisis, the government have added an extra £500bn of potential liabilities. Note: the Government has offered to back mortgage securities. They are unlikely to spend this money. But, in theory the government could be liable for extra debts of up to £500bn. If we include this bailout package as a contingent liability National debt would be well over 100% of GDP. However with an improvement in bank sector, the necessity for these bailouts look unlikely, unless there is a very sharp deterioration in global finance.
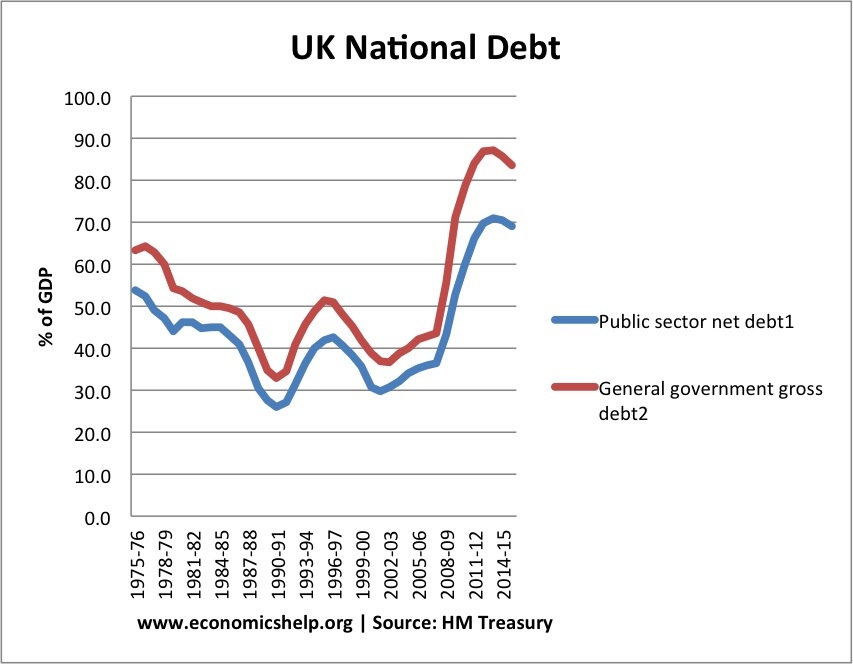
Forecast for National Debt
See Graph 5 at end of article
UK Debt
UK public finances at HM Treasury
Current forecasts for UK debt predict that the UK debt to GDP ratio will peak at 71% in 2013/14
By 2015/16 there will be a fall in debt to GDP ratio to 69% of GDP
However, this forecast of debt reduction is based on relatively optimistic forecasts for economic growth. Given increased risk of economic stagnation or even double dip recession, tax revenues are likely to be lower than anticipated. If the UK does enter recession, it will be very difficult to stabilise debt to GDP ratio by 2015.
General government gross debt is a slightly wider definition of debt. It is used in the Maastricht criteria for defining debt.
Debt including Financial sector intervention
See Graph 6 at end of article
Problems of National Debt
Interest Payments. The cost of paying interest on the government’s debt is very high. In 2011 Debt interest payments will be £48 billion a year (est 3% of GDP). Public sector debt interest payments will be the 4th highest department after social security, health and education. Debt interest payments could rise close to £70bn given the forecast rise in national debt.
Higher Taxes / lower spending in the future.
Crowding out of private sector investment / spending
The structural deficit will only get worse as an ageing population places greater strain on the UK’s pension liabilities. (demographic time bomb)
Potential negative impact on exchange rate (link)
Potential of rising interest rates as markets become more reluctant to lend to the UK government.
However, Government Borrowing is not always as bad as people fear.
Borrowing in a recession helps to offset a rise in private sector saving. Government borrowing helps maintain aggregate demand and prevents fall in spending
In a liquidity trap and zero interest rates, governments can often borrow at very low rates for a long time (e.g. Japan) This is because people want to save and buy government bonds
Savage austerity measures (e.g. cutting spending and raising taxes) can lead to a decrease in economic growth and cause the deficit to remain the same % of GDP. Austerity measures and the economy | Timing of austerity
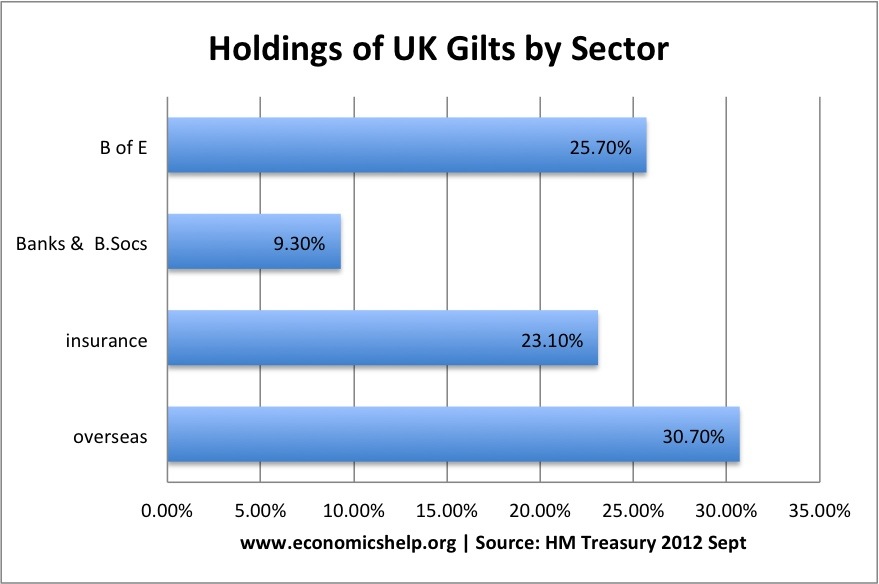
Who Owns UK Debt?
The majority of UK debt used to be held by the UK private sector, in particular, UK insurance and pension funds. In recent years, the Bank of England has bought gilts taking its holding to 25% of UK public sector debt.
Overseas investors own about 30% of UK gilts.
See Graph 7 at end of article
More at: who owns UK debt?
Total UK Debt – Government + Private
Another way to examine UK debt is to look at both government debt and private debt combined.
Total UK debt includes household sector debt, business sector debt, financial sector debt and government debt. This is over 500% of GDP.Total UK Debt
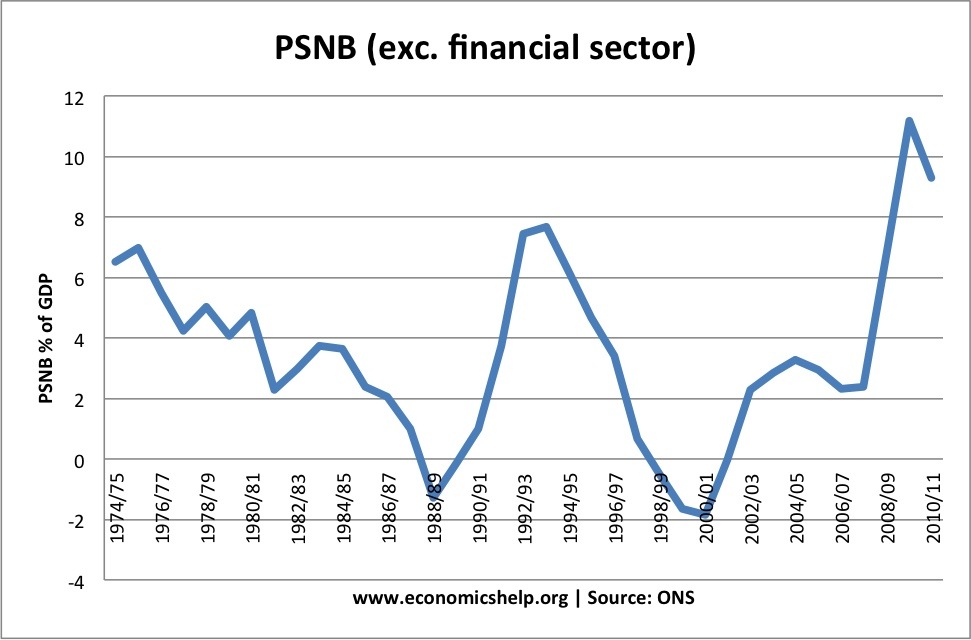
UK Budget Deficit
The UK budget deficit is the annual borrowing requirement. It is measured by public sector net borrowing.
See Graph 8 at end of article
Graph 1

Graph 2
Graph 3
Graph 4
Graph 5
Graph 6

Graph 7
Graph 8

ONS is aware that the current methodology for accruing the cash paid by government for gilt coupons is an overly simplistic one and not fully in line with international National Accounts guidance. ONS and HMT have been working on an improved methodology of accruing these gilt coupon payments. Implementation of the new methodology in Public Sector Finances will have no impact on public sector net debt or net cash requirement but will impact on central government accrued current expenditure and therefore public sector net borrowing. Latest estimates are that the impact of the revision will be to increase central government expenditure on accrued interest, and so net borrowing, by approximately £250 million for 2011/12 and 2010/11, £400 million for 2009/10, £500 million for 2008/09 and smaller amounts for previous years. It is planned to implement the methodological change in the Public Sector Finances, June 2012 bulletin.
LikeLike